Figure 5.
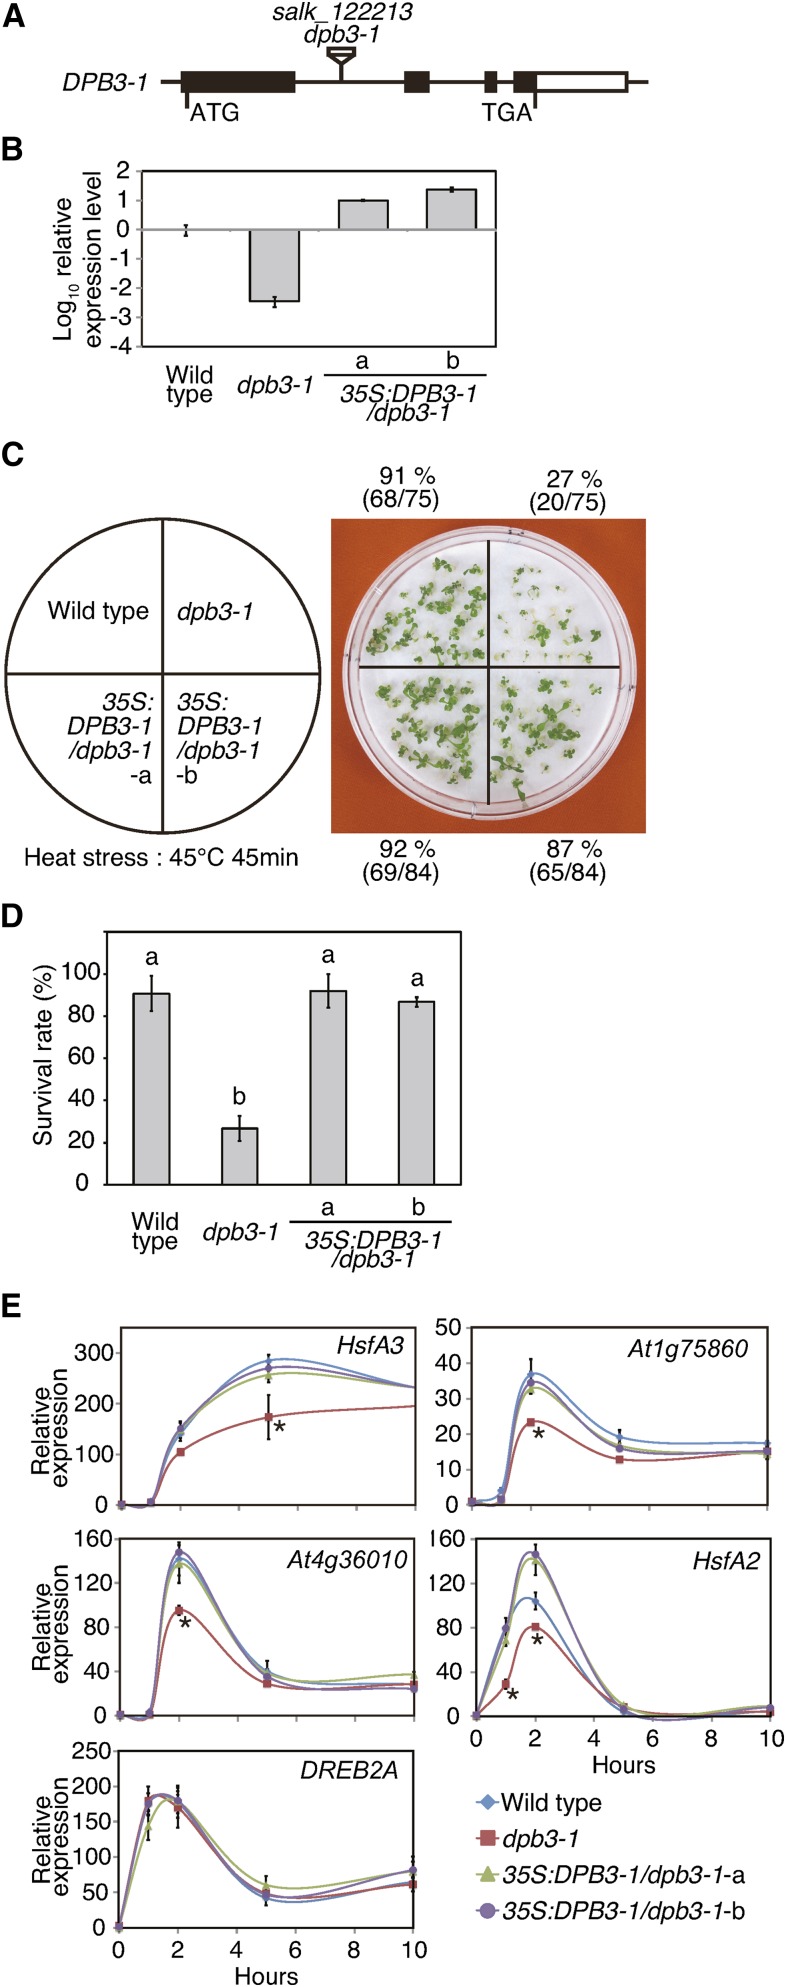
The dpb3-1 Mutant Is Sensitive to Heat Stress and Exhibited Impaired Expression of Heat-Inducible Genes.
(A) A gene model of DPB3-1 and the T-DNA insertion in the dpb3-1 mutant. The coding region, untranslated regions, and introns are indicated as a closed box, open boxes, and lines, respectively.
(B) Relative DPB3-1 gene expression in wild-type, dpb3-1, and 35S:DPB3-1/dpb3-1 plants as determined by quantitative RT-PCR. The error bars indicate sd. The values are shown in the log scale.
(C) Heat stress tolerance of the dpb3-1 mutant. The experiments were performed as described in Figure 3E, except that the plants were treated at 45°C for 45 min.
(D) Percentages of surviving plants after the heat stress tolerance test. Each data point is the mean of three experiments, and each experiment comprised 28 plants. The letters above the bars indicate significant differences between the plants (P < 0.05 according to Tukey’s multiple range test). The mutant plants showed significantly higher sensitivity to heat than the wild-type plants.
(E) Quantitative RT-PCR analysis of the expression levels of several heat stress-inducible genes during heat stress (37°C). The expression level of each gene in the wild-type plant before the stress treatment was defined as 1.0. The error bars indicate sd (n = 3). The asterisk indicates the time point at which the expression level of each gene in the dpb3-1 mutant was significantly decreased compared with the wild-type and 35S:DPB3-1/dpb3-1 plants (P < 0.05 according to Tukey’s multiple range test).

