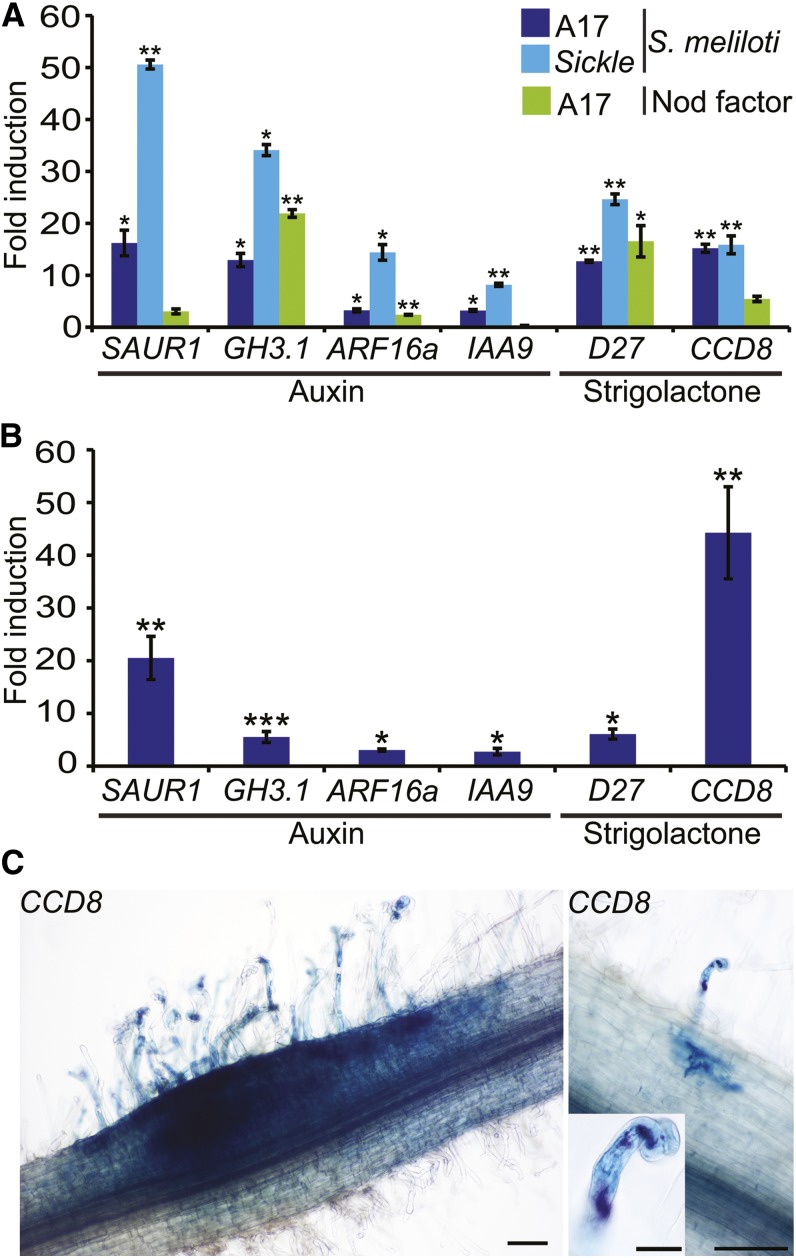
Figure 6.
Auxin Signaling and SL Biosynthesis Genes Are Induced by S. meliloti and by Nod Factors.
(A) Microarray-based quantification of expression of auxin signaling genes SAUR1, GH3.1, ARF16a, and IAA9 and SL biosynthetic genes D27 and CCD8 at 5 dpi with S. meliloti or 1 d post-treatment with Nod factors in the wild type and skl.
(B) qPCR confirmation of the induction of auxin signaling and SL biosynthetic genes at 5 dpi with S. meliloti.
(C) Analysis of expression of the SL biosynthesis gene CCD8 using a promoter-GUS fusion in A. rhizogenes-induced transgenic roots stained for GUS activity (image on left). The image on the right shows staining of both CCD8:GUS (blue) and S. meliloti (lacZ) (magenta/purple). Bars in main images = 100 μm; insets = 20 μm. Significant induction relative to control experiments are shown (*P < 0.05, **P < 0.01, and ***P < 0.001). Error bars = se (n = 3).

