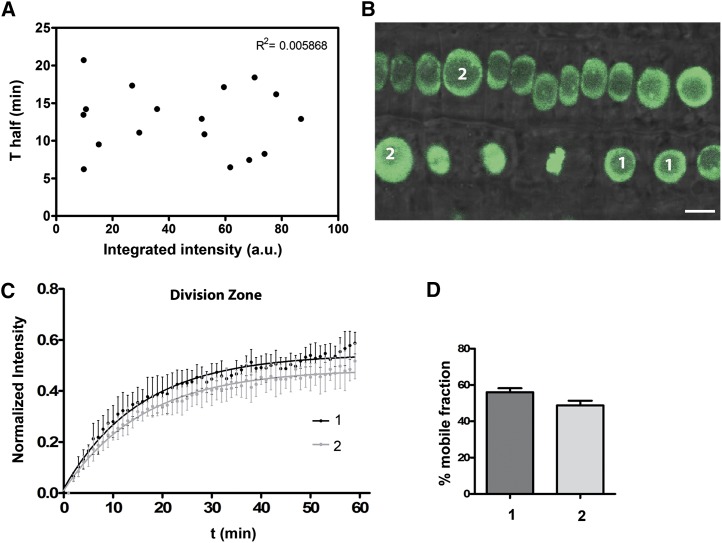
Figure 3.
H2B-GFP Dynamics during the Cell Cycle.
(A) Half-time (t1/2) for recovery plotted against the total integrated intensity for each H2B-GFP expressing nucleus. No correlation was observed (R2 = 0.005868).
(B) Root epidermal cells in the division zone expressing H2B-GFP showing cells at different stages of the cell cycle as evidenced by the different morphologies and sizes of the nuclei (nuclei with 5 to 6 μm in diameter are labeled with 1 and nuclei with 8 to 9 μm in diameter are labeled with 2). Bars = 5 μm.
(C) Quantitative analysis of FRAP experiments for nuclei classified as 1 or 2, showing no significant differences in recovery.
(D) Estimated mobile fraction. Values represent means ± se from 5 cells.

