Figure 4.
Histone Acetylation Affects Root Development and Meristem Size.
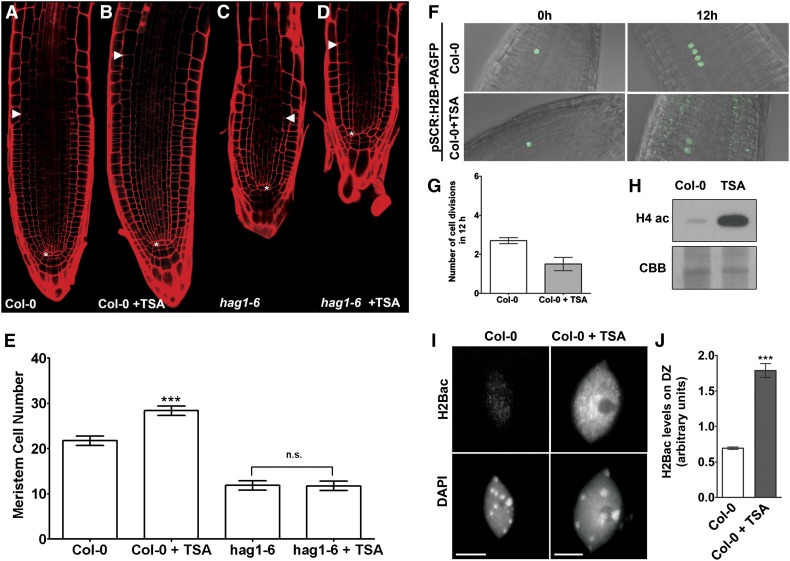
(A) to (D) Four-day-old root meristems of wild-type plants (A), wild-type plants treated overnight with 100 ng/mL TSA (B), hag1-6 mutant (C), and hag1-6 mutant treated overnight with TSA (D).
(E) Root meristem cell number of plants depicted in (A) to (D). Root meristem size is expressed as the number of cortex cells in a file extending from the quiescent center (asterisk) to the first elongated cortex cells (white arrowheads). Data are shown as mean ± se (n = 8 to 10). Student’s t test, ***P < 0.001; n.s., not significant.
(F) Four-day-old wild-type plants expressing H2B-PAGFP were photoactivated in a single nucleus and cell division was observed after 12 h in control situation and after treatment with 100 ng/mL TSA. In order to detect the GFP signal 12 h after photoactivation, the detector gain was increased to compensate for dilution of signal after cell division and photobleaching. This increased the visibility of the observed autofluorescence throughout the tissue, especially evident in TSA-treated samples.
(G) Number of cell divisions counted during a period of 12 h; values represent means ± se (n = 10).
(H) Immunoblot for H4ac in protein extracts from whole Col-0 roots showing an increase in the acetylation levels after overnight treatment with TSA. Coomassie blue (CBB) shows protein loading.
(I) Representative immunolabeling images of Arabidopsis nuclei from the differentiation zone with an antibody against H2BK20ac in wild-type plants showing an increase in the acetylation levels after treatment with TSA. Bars = 5 μm.
(J) Quantitative analysis of immunolabeling experiment depicted in (I). Values represent means ± se from 10 cells.

