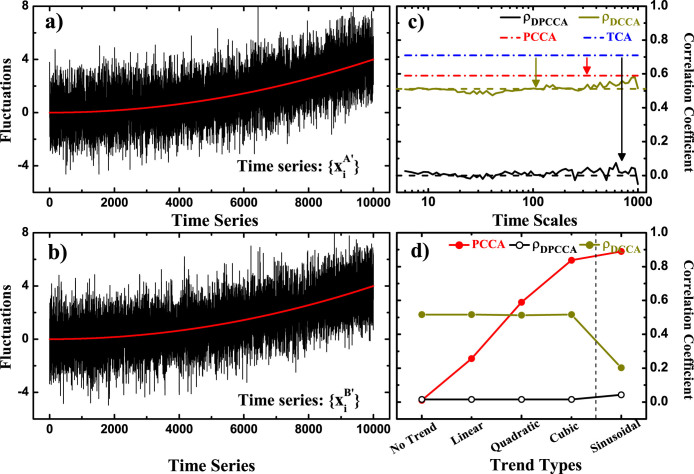
Figure 3. Time series and related results in Test I.
(a, b) show the two time series  and
and  in test I, but with quadratic trends. The results of traditional cross-correlation analysis (TCA, blue), partial cross-correlation analysis (PCCA, red), detrended cross-correlation analysis (DCCA cross-correlation coefficient ρDCCA, yellow), as well as the detrended partial-cross-correlation analysis (DPCCA, black) are shown in (c). In (d), more cases with higher-order trends are shown. For each “Trend Type”, the detrend order of DPCCA (DCCA) are different, as DPCCA1 (DCCA1), DPCCA2 (DCCA2), DPCCA3 (DCCA3), DPCCA4 (DCCA4), and DPCCA16 (DCCA16), respectively. The coefficient of each “Trend Type” is actually the mean correlation coefficient averaged over all the time scales in (c).

