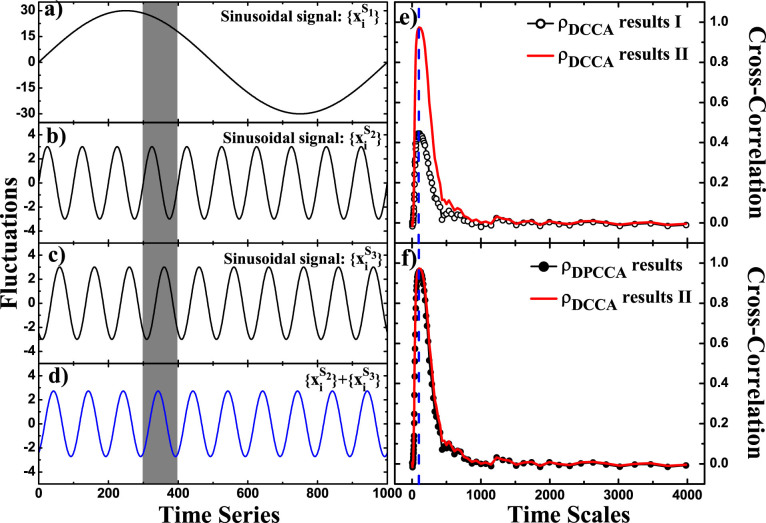
Figure 4. Time series and related results in Test II.
(a–c) show fractions of the three sinusoidal signals in test II:  ,
,  , and
, and  .
.  acts as a background field, with low-varying frequency and larger amplitude.
  , and
, and  have different phases (see the gray part), and their combination is shown in (d). The red curve in (e) is the DCCA cross-correlation coefficient ρDCCA between
  and
and  (denoted as ρDCCA results II), and the blue dashed line shows the time scale of 100 (days). If the signal
  in
in  is offset by
  , ρDCCA fails in providing accurate results, as shown in (e), the black open-circle curve (denoted as ρDCCA results I). But DPCCA succeeds, as shown in (f), the black solid-circle curve.

