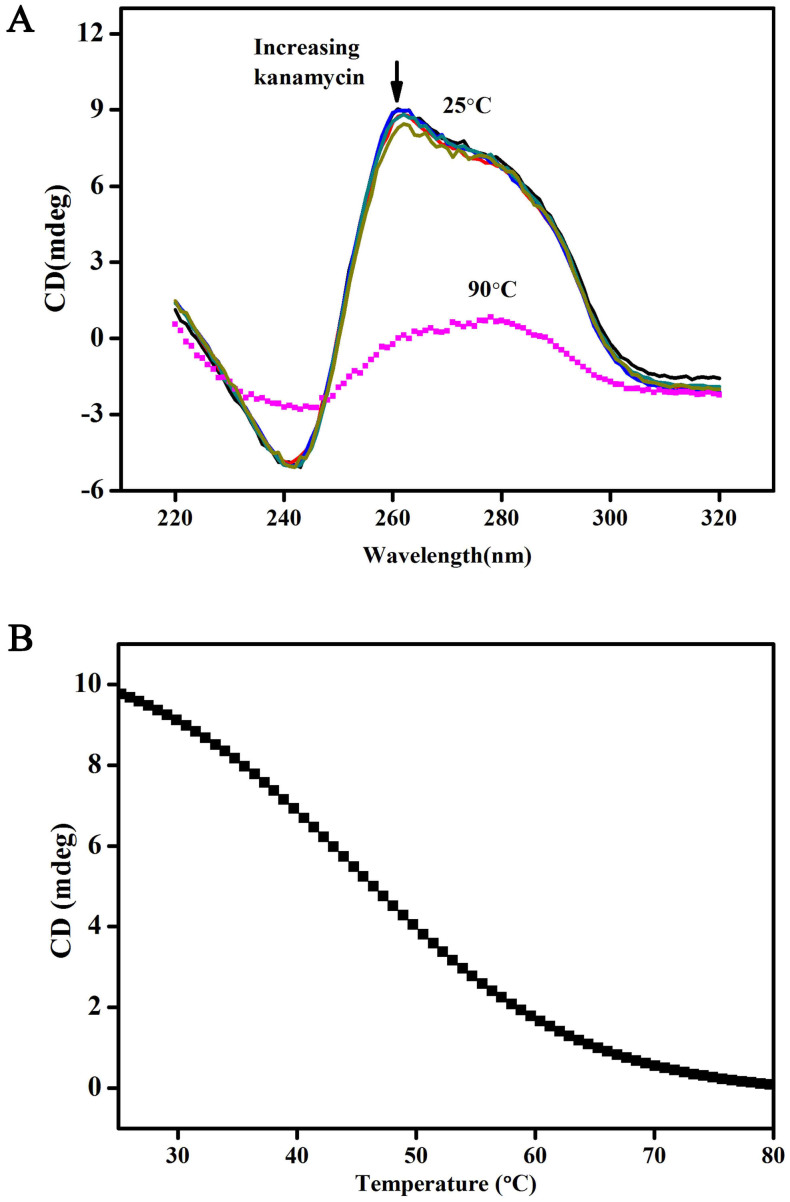
Figure 2.
(A) CD spectra of the oligonucleotides at a strand concentration of 15 μM with kanamycin (Solid line, from top to bottom: 0, 1, 5, 10, 20, and 50 μM) at 25°C and without kanamycin (dotted line) at 90°C in the 10 mM Tris–HCl buffer containing 10 mM NaCl (pH 7.2); (B) CD melting curves for the oligonucleotides monitored at 260 nm in 10 mM Tris–HCl buffer containing 10 mM NaCl (pH 7.2).

