Figure 5.
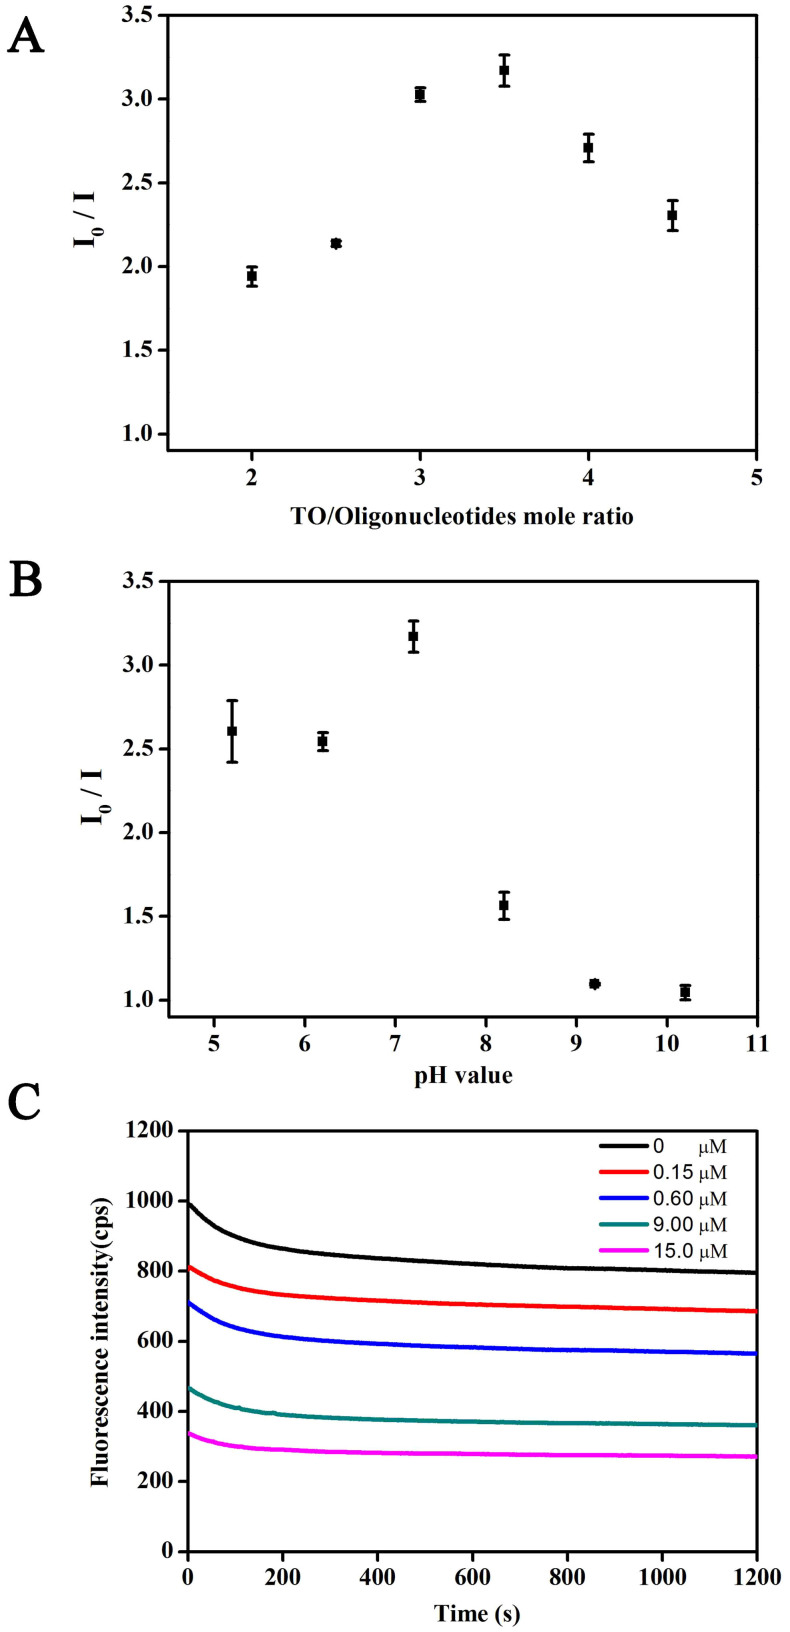
Signal ratios of fluorescence intensities (I0/I) before and after the addition of kanamycin to a final concentration of 20 μM at (A) different TO/oligonucleotide mole ratios by varying TO concentrations ranging from 20, 25, 30, 35, 40, and 45 μM with a fixed oligonucleotide strand concentration of 10 μM; and (B) different pH values ranging from 5.2, 6.2, 7.2, 8.2, 9.2, to 10.2. (C) Time course of fluorescence signals upon the addition of kanamycin at different concentrations (0, 0.15, 0.60, 9.00, and 15.00 μM) under the optimized pH of 7.2 and TO/oligonucleotide mole ratio of 0.35 μM to 10 μM. All measurements were conducted in 10 mM Tris–HCl buffer (pH 7.2) containing 10 mM NaCl. Error bars in A and B represent the standard deviations in three individual experiments.

