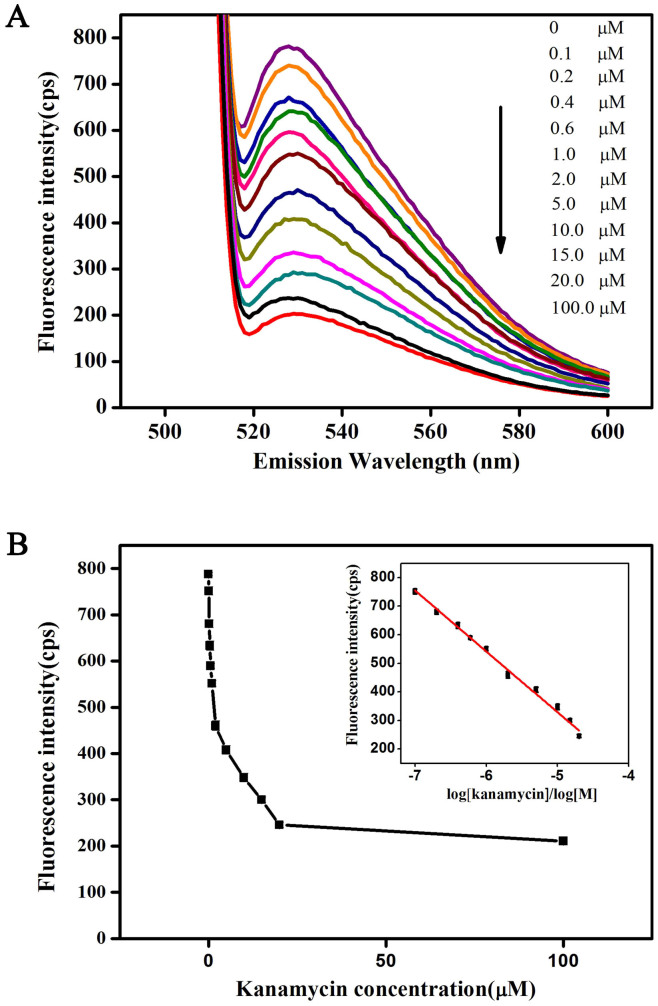
Figure 6.
(A) Typical fluorescence spectra of TO/Kanamycin-binding DNA aptamer in the absence and presence of different kanamycin concentrations ranging from 0.1, 0.2, 0.4, 0.6, 1, 2, 5, 10, 15, 20, and 100 μM in 10 mM Tris–HCl buffer (pH 7.2) containing 10 mM NaCl. (B) Relationship between the fluorescence intensities at 530 nm and their corresponding kanamycin concentrations. Inset: calibration plot for kanamycin detection (error bars represent the standard deviations in three individual experiments).

