
Fig. 1.
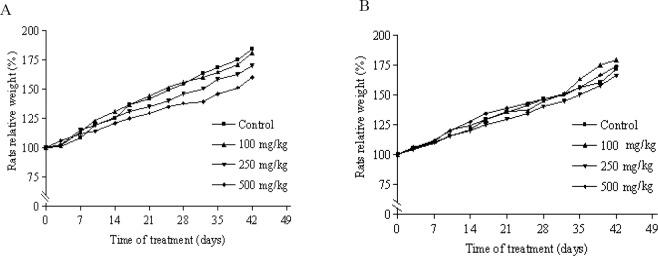
Changes in male (A) and female (B) rats body weight with duration of subchronic treatment. Each point represents mean ± SEM, n = 5.
Official websites use .gov
A
.gov website belongs to an official
government organization in the United States.
Secure .gov websites use HTTPS
A lock (
) or https:// means you've safely
connected to the .gov website. Share sensitive
information only on official, secure websites.
Changes in male (A) and female (B) rats body weight with duration of subchronic treatment. Each point represents mean ± SEM, n = 5.