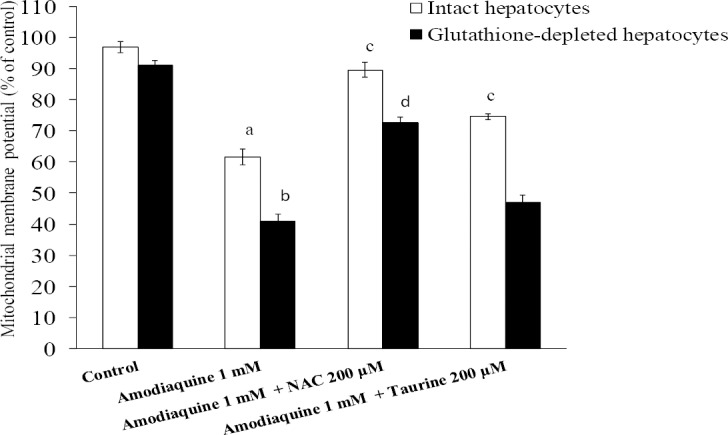
Fig. 6.

Mitochondrial depolarization induced by amodiaquine and the role of NAC and/or taurine. Data are given as Mean ± SEM for at least three separate experiments as assessed 60 min after incubation. Isolated rat hepatocytes (106 cells/mL) were incubated at 37°C in rotating round bottom flasks with 95% O2 and 5% CO2 in Krebs-Henseleit buffer (pH 7.4). a,bDifferent from control groups (n=3, ANOVA, P<0.05). cDifferent from amodiaquine-treated hepatocytes (n=3, ANOVA, P<0.05). dDifferent from amodiaquine-treated cells which were glutathione-depleted (n=3, ANOVA, P<0.05).
