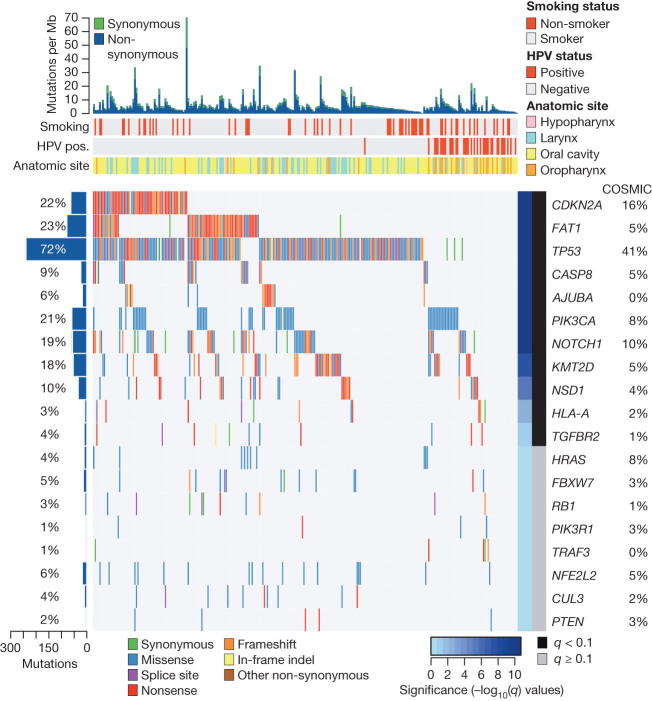
Figure 2. Significantly mutated genes in HNSCC.
Genes (rows) with significantly mutated genes (identified using the MutSigCV algorithim; q < 0.1) ordered by q value; additional genes with trends towards significance are also shown. Samples (columns, n = 279) are arranged to emphasize mutual exclusivity among mutations. Left, mutation percentage in TCGA. Right, mutation percentage in COSMIC (‘upper aerodigestive tract’ tissue). Top, overall number of mutations per megabase. Colour coding indicates mutation type.

