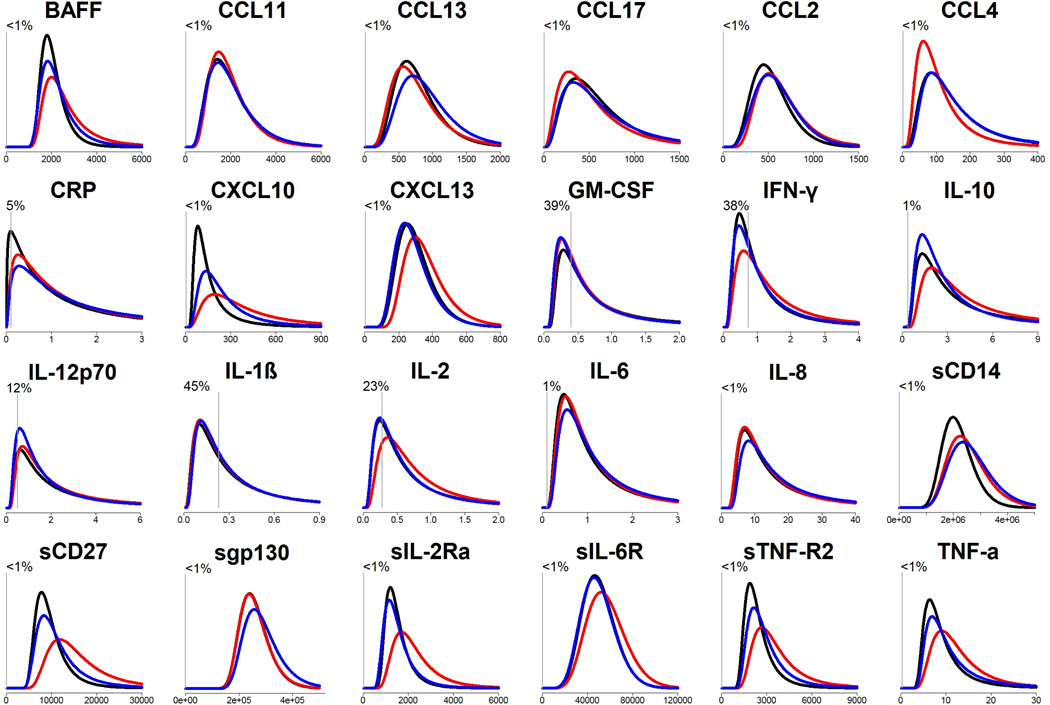
Figure 1.
Estimated distributions of biomarker levels for HIV-negative, HIV+ HAART-naïve, and HIV+ virally suppressed person-visits.
Results are from saturated generalized gamma models. X-axis: pg/mL. Y-axis: probability density. Black=HIV-negative (NEG), red=HIV+ HAART-naïve (NAI), blue=HIV+ virally suppressed (SUP). Vertical gray lines represent the median lower limit of detection for assays. The percentage represents % of biomarker measurements that were below the lower limit of detection (right-censored by models by inverting values). Details of model estimates are shown in Supplemental Table 1.

