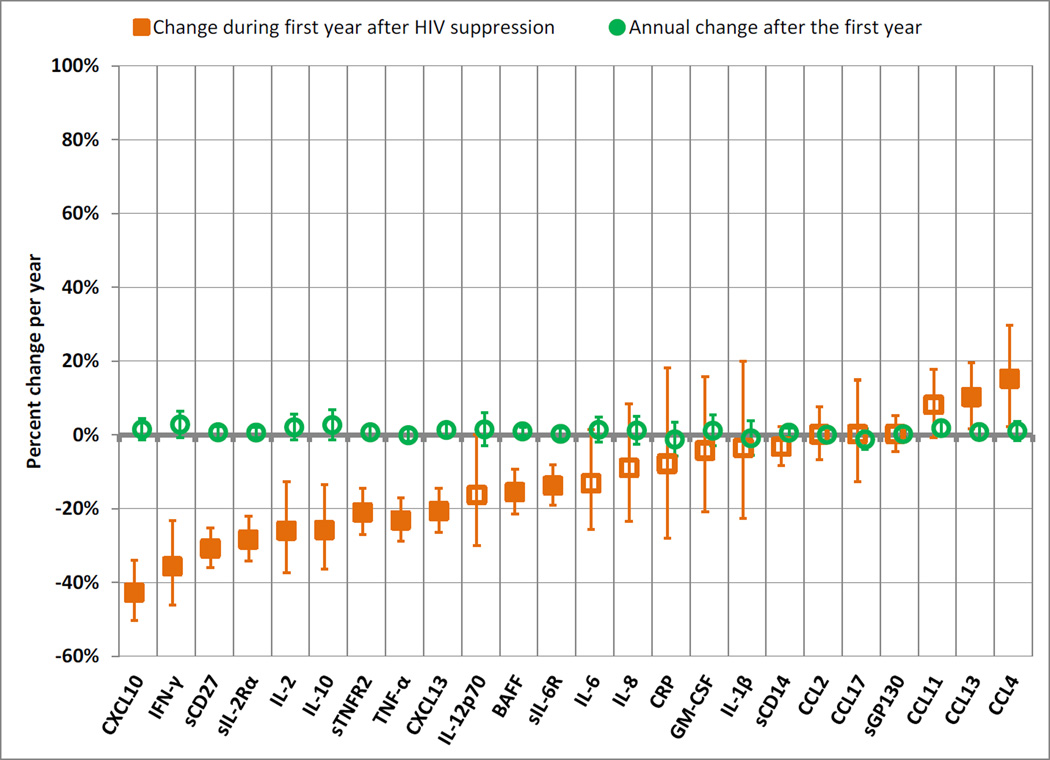
Figure 3.
Changes inbiomarker values during the first year after HIV viral suppression, and annual changes for each subsequent year, by estimated differences across percentiles from generalized gamma models.
Orange squares represent the percent change in biomarker values during the first year after HIV suppression. Green circles represent the annual percent change in biomarker values after the first year of HIV suppression. Error bars represent 99.7% confidence intervals, calculated with Bonferroni adjustment to maintain a family-wise error rate of 0.05. Filled markers represent differences that were statistically significant after Bonferroni adjustment (p<0.002). Location parameters of generalized gamma models were allowed to differ by exposure category, while scale and shape parameters were held constant. Details of model estimates are shown in Supplemental Table 3.

