
Figure 3.
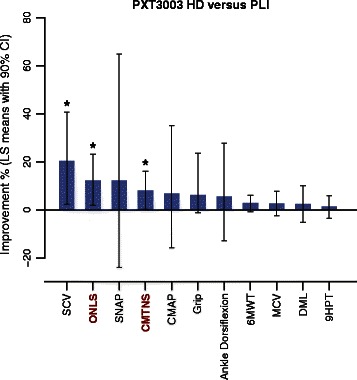
Summary of the efficacy analysis, HD versus PLI. Least squares mean percentages of relative improvement after 12 months with 90% CI in all efficacy outcomes after 12 months for HD versus PLI (obtained from Table 4), assessed by the ANCOVA efficacy analysis and sorted from highest to lowest value. Sample sizes: PLI (n = 61), HD (n = 19). The two main efficacy outcomes, CMTNS and ONLS, are indicated with red bold characters. *P < 0.05.