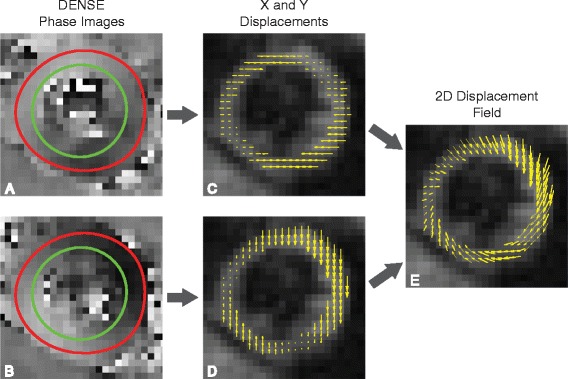
Figure 1.

Two-dimensional displacements measured by DENSE. The first column (A,B) contains X and Y phase images obtained during systole for a healthy volunteer. The red and green contours define the epicardial and endocardial borders of the left ventricle, respectively. Each pixel within each phase image represents the Eulerian displacement in a single direction (C,D). The displacements are overlaid on the magnitude image from DENSE. The third column (E) contains the 2D Eulerian displacement field that results from vector addition.
