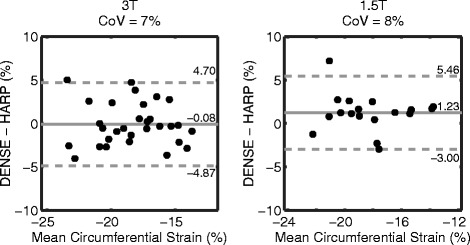
Figure 7.

Bland-Altman plots for circumferential strain between DENSE and HARP. The solid lines indicate the biases while the dashed lines are the 95% limits of agreement. The 95% limits and CoVs between DENSE and HARP were larger than DENSE inter-observer variability.
