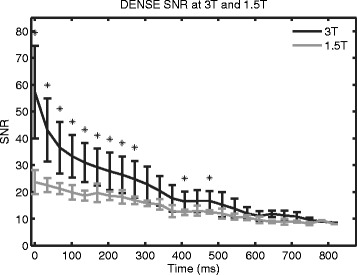
Figure 8.

Spiral cine DENSE SNR at 3T and 1.5T. Average SNR curves from all subjects were calculated at 3T and 1.5T. Spiral cine DENSE imaging was performed with a constant 20° flip angle. The SNR at 3T was higher than at 1.5T through 750 ms. Statistical significance (p < 0.05) is indicated by asterisks. The last significant difference occurred at 476 ms.
