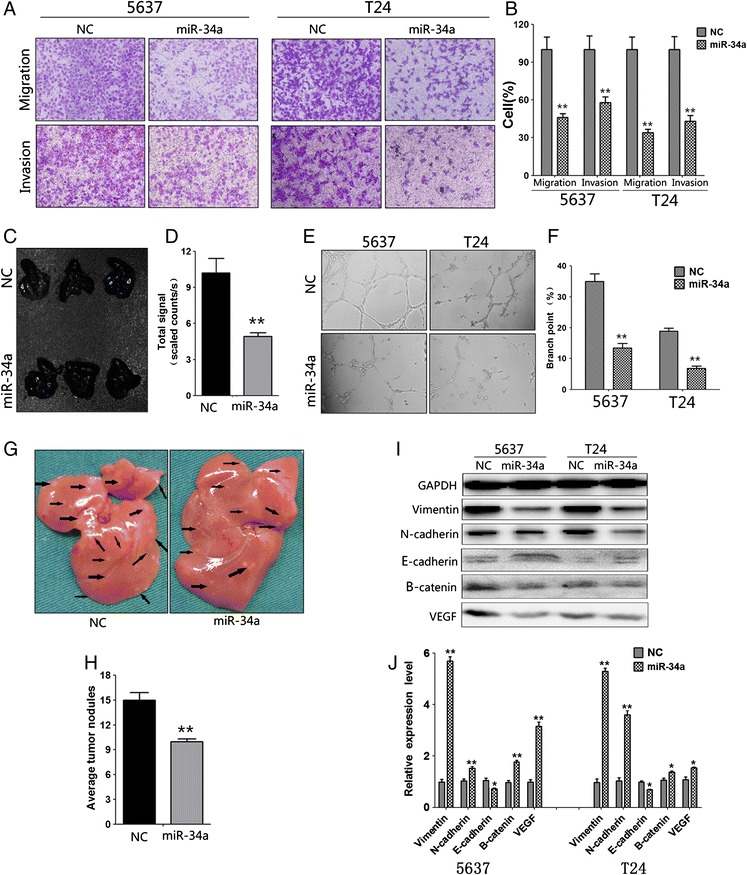
Figure 2.

Overexpression of mir-34a inhibits bladder cancer cell invasion and migration and tube formation. A, migration and invasion assay for renal cancer cells. Representative photographs were taken at × 200 magnification. B, number of migrated and invaded cells were quantified in 4 random images from each treatment group. Results are the mean ± SEM from 2 independent experiments plotted as percent (%) migrating and invading cells relative to NC treatment. C, representative bioluminescent images of lungs in nude mice at the 30th days after IV injection. D, quantification analysis of fluorescence signal from captured bioluminescence images. E, Tube formation of HUVECs was determined by assaying the numbers of branch nodes after 6 h of culture under a phase contrast microscope. F, number of branch point was quantified. HUVECs were cultured in the following media: Culture Media of 5637 and T24 cells transfected with mir-34a and NC. G, metastatic nodules in the liver. H, number of nodules was quantified. I, EMT related proteins and VEGF were determined by immunoblot analysis. J, the density of blots was quantified to show the expression level of EMT related proteins and VEGF, GAPDH was used as control. NC, Negative Control. *, P < 0.05; **, P < 0.01.
