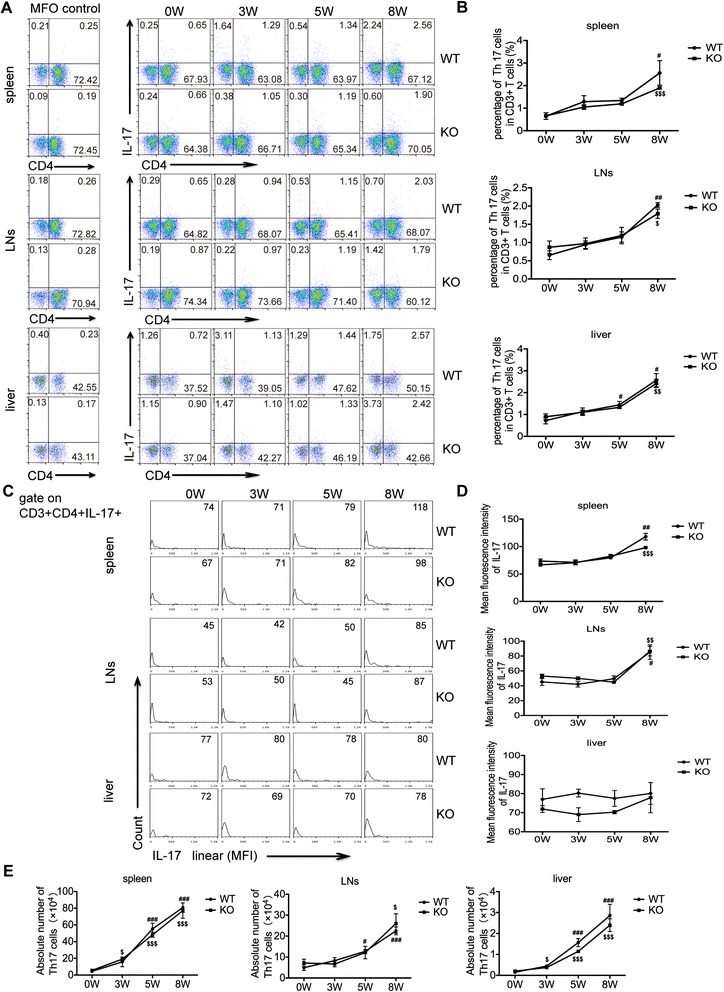
Figure 4.

Th17 cell responses show no statistically significant difference between AQP4 KO and WT mice after S. japonicum infection. At 0, 3, 5, 8 weeks post-infection, four AQP4 WT or KO mice were sacrificed and single cell suspension of splenocytes, mesenteric lymphocytes or liver cells were prepared for FCM analysis of Th17 cells. (A) The cells were gated on CD3+ splenocytes,lymphocytes or liver cells from AQP4 WT or KO mice for the detection of Th17 cells. (B) The proportion (gated on CD3+ cells) of Th17 cells in the spleen, lymph nodes and livers. Representative histograms obtained by FCM analysis (C) of mean fluorescence intensity (MFI) of IL-17 expression in Th17 cell (D). (E) The absolute number of Th17 cells in the spleen, lymph nodes and livers. Data represent means ± SD of 8 mice from two independent experiments. #P < 0.05, ##P < 0.01, ###P < 0.001 vs. AQP4 WT-0 W; $P < 0.05, $$P < 0.01, $$$P < 0.001 vs. AQP4 KO-0 W; *P < 0.05, **P < 0.01, ***P < 0.001 Th17 cells from AQP4 KO mice vs. from AQP4 WT mice at 0, 3, 5, 8 weeks post-infection.
