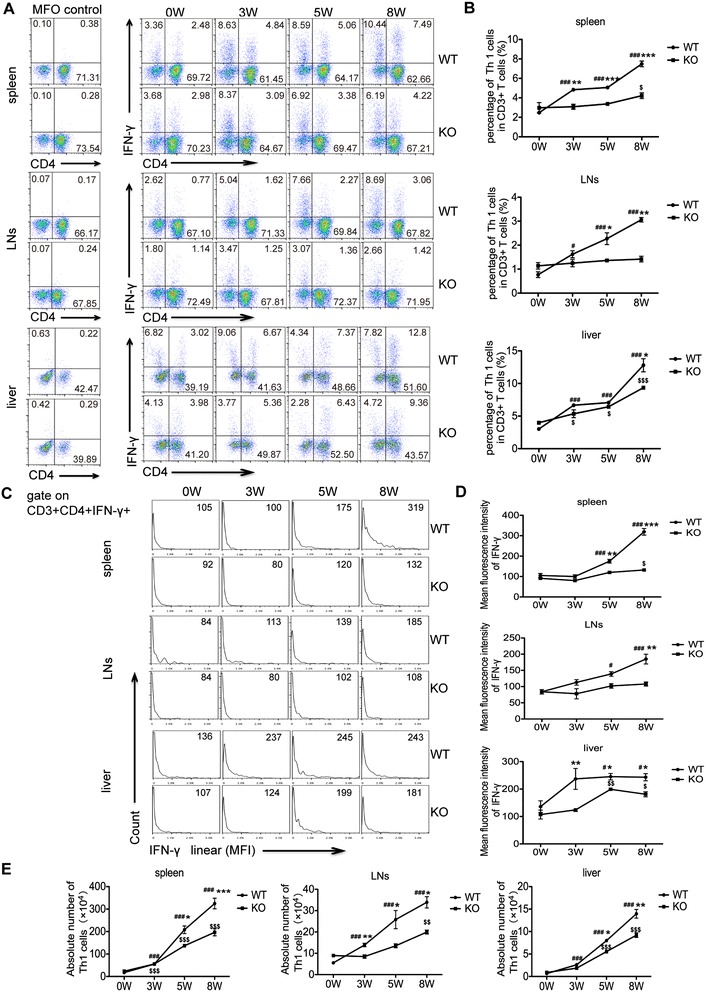
Figure 5.

Th1 cell responses are decreased in S. japonicum- infected AQP4 KO mice . (A) At 0, 3, 5, 8 weeks post-infection, the generation of IFN-γ producing-CD3+CD4+ cells in the spleen, lymph nodes and liver of AQP4 WT and KO mice was determined by intracellular staining and FCM. (B) The proportion (gated on CD3+ cells) of Th1 cells in mouse spleen, lymph nodes and livers. Representative histograms obtained by FCM analysis (C) of mean fluorescence intensity (MFI) of IFN-γ expression in Th1 cells (D). (E) The absolute number of Th1 cells in mouse spleen, lymph nodes and livers. Data represent means ± SD of 8 mice from two independent experiments. #P < 0.05, ##P < 0.01, ###P < 0.001 vs. AQP4 WT-0 W; $P < 0.05, $$P < 0.01, $$$P < 0.001 vs. AQP4 KO-0 W; *P < 0.05, **P < 0.01, ***P < 0.001 Th1 cells from AQP4 KO mice vs. from AQP4 WT mice at 0, 3, 5, 8 weeks post-infection.
