
FIGURE 2.
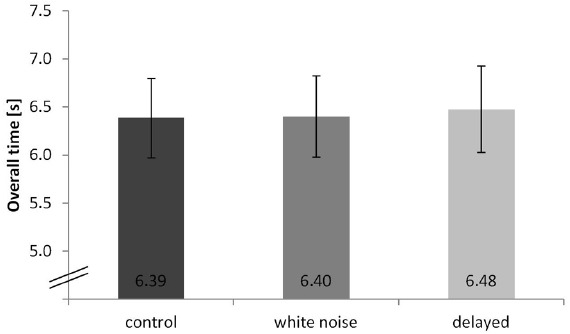
Overall time of the hurdling task—different conditions displayed in seconds. Error bars indicate the standard deviation.
Official websites use .gov
A
.gov website belongs to an official
government organization in the United States.
Secure .gov websites use HTTPS
A lock (
) or https:// means you've safely
connected to the .gov website. Share sensitive
information only on official, secure websites.
Overall time of the hurdling task—different conditions displayed in seconds. Error bars indicate the standard deviation.