
Figure 2.
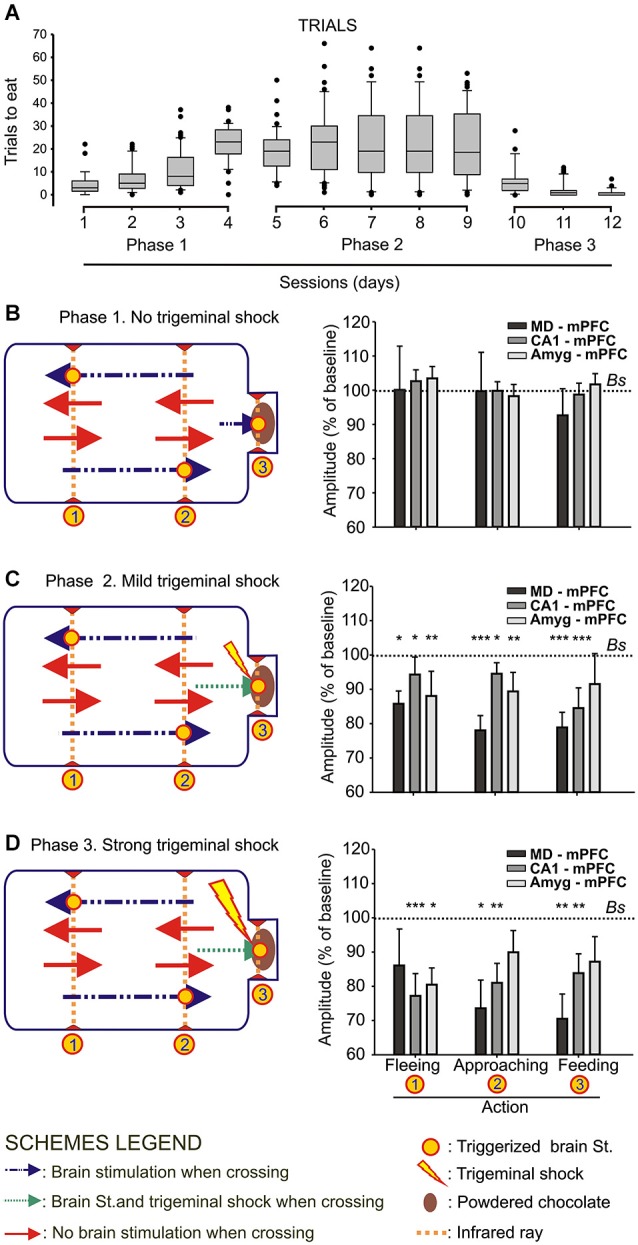
Animal performance and changes in strength evoked at the MD-mPFC, CA1-mPFC, and Amyg-mPFC synapses during a food/shock decision-making task. (A) On the left are shown whisker boxes summarizing the number of trials to obtain food during the first phase of the experiment: sessions 1–4, in absence of trigeminal shocks. The five middle boxes (sessions 5–9) illustrate the number of trials carried out by mice in the presence of a mild trigeminal shock (second phase). Finally, the three right boxes (sessions 10–12) illustrates the significant decrease in the number of trials in the presence of a strong trigeminal shock presented each time the animal tried to obtain food (third phase). (B) Changes in the amplitude of fPSPs evoked at the three selected synapses during fleeing from the feeder, approaching it, or during feeding. Baseline values were collected before the beginning of the experimental session. On the left is included a diagram illustrating the experimental design. Note that no significant differences in fPSP amplitudes were observed in any of the three synapses for the three selected behaviors when no trigeminal shocks were presented to the animals. (C,D) Changes in the amplitude of fPSPs evoked at the three selected synapses for the same selected behaviors when the animal received a mild (C) or strong (D) trigeminal shock on introducing its head into the feeder. The different signs used in the Figure are defined in the bottom legends. Bs, Baseline. Significant differences with baseline values are indicated. Data are presented as mean ± SEM, n ≥ 8 animals/group. *p < 0.05; **p < 0.01; ***p < 0.001. Bonferroni’s post hoc test. One-way ANOVA.