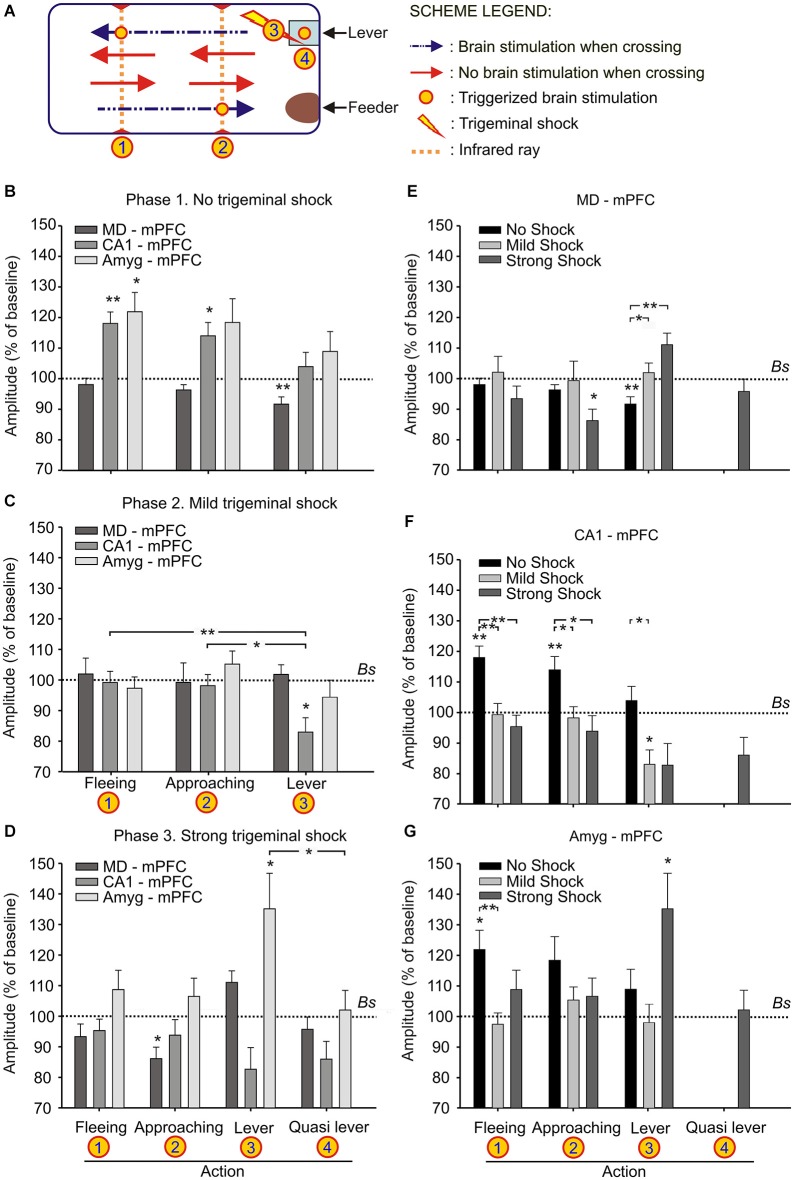
Figure 3.
Changes in strength evoked at the MD-mPFC, CA1-mPFC, and Amyg-mPFC synapses during a decision-making, operant conditioning task. (A) Experimental design. We recorded fPSPs evoked at the three selected synapses during fleeing from the lever, approaching it, or during lever presses. The different signs used in the Figure are defined in the legends to the right. (B–D) Changes in the amplitude of fPSPs evoked at the three selected synapses during fleeing from the lever, approaching it, or during lever presses in the control situation (B), and when the animal received a mild (C) or a strong (D) trigeminal shock right after pressing the lever. The “Quasi lever” columns indicate fPSP values collected when the animal was not pressing the lever, but located near it. Baseline values were collected before the beginning of the experimental session. (E–G) The same set of fPSP data, but organized according to the selected synapse: MD-mPFC (E), CA1-mPFC (F), and Amyg-mPFC (G). Data are presented as mean ± SEM, n ≥ 8 animals/group. *p < 0.05; **p < 0.01. Comparisons were made between behaviors vs. experimental phases (B–D) and behaviors vs. cerebral areas (E–G). Bs, Baseline. Asterisks outside lines compare fPSP amplitudes with baseline values (Dunnett post hoc test). Asterisks within lines indicate significant differences between fPSPs evoked at the same synapses during the performance of different behaviors (C,D) or during the performance of the same behavior in different phases of the experiment (E–G) (Bonferroni’s post hoc test). One-way ANOVA.

