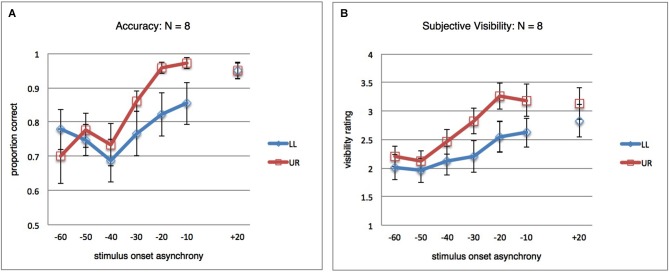
Figure 3.
Results for post hoc analysis. (A) Orientation discrimination accuracy, as in Figure 2A, but for a subset of participants (N = 8). The four participants excluded here were responsible for the difference between LL and UR at SOA +20 ms observed in Figure 2A. In the remaining subject sample, the pattern of global and local masking mirrors that observed in the full dataset. (B) Same as in (A), but results for the subjective orientation visibility rating task.

