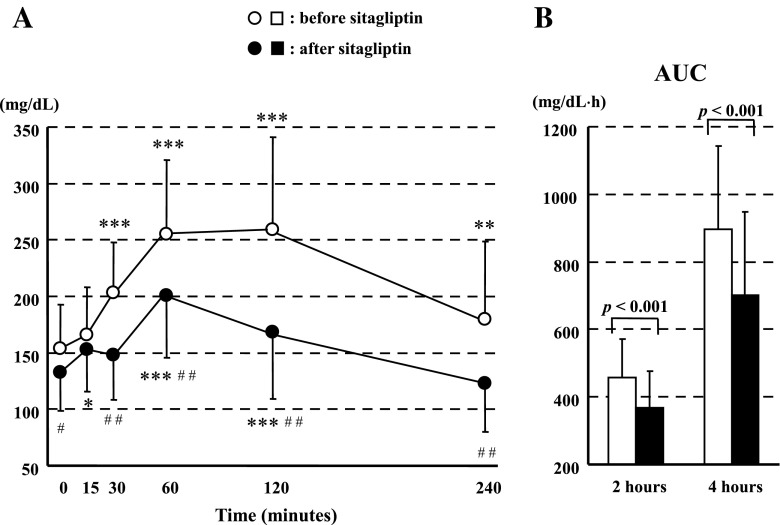
Fig. 1.
Meal tolerance test results for glucose: changes in (a) plasma concentration and (b) area under the concentration–time curve (AUC). *p < 0.05, **p < 0.01, and ***p < 0.001 versus 0 min, and # p < 0.05 and ## p < 0.001 versus before sitagliptin treatment (i.e., calorie-restricted diet only) (determined by Fisher’s least significant difference procedure after two-way repeated ANOVA). Differences in AUCs were analyzed by paired t test. Graphs were plotted using means ± standard deviation

