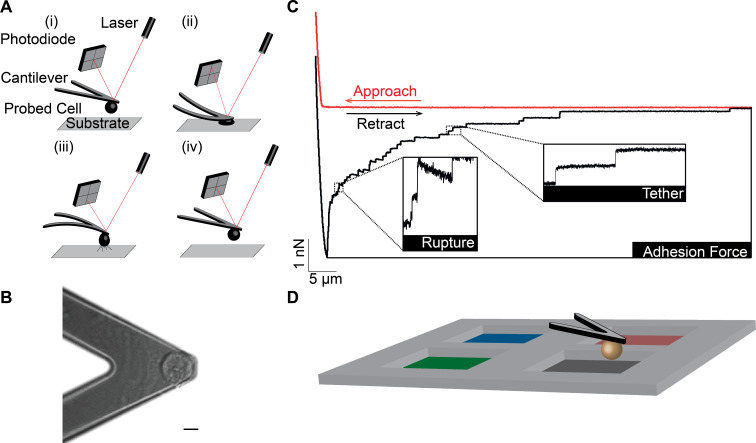
Figure 1.
Depiction of AFM-based SCFS. (A,B) A single cell is bound to a tip-less AFM cantilever via a receptor specific or unspecific substrate (scale bar, 10 µm). (A) (i and ii) The cantilever-bound cell is brought into contact with the substrate until a preset force is recorded. After a specified contact time, (iii) the cantilever is retracted until the cell is fully detached from the substrate. During the experimental cycle, the deflection (force) of the cantilever and the distance between cell and surface is recorded in a force–distance curve (red). (C) The force–distance curve shows distinct features: In the approach segment of the force–distance curve, the deflection of the cantilever is recorded while the cell is lowered onto the substrate; the retraction segment of the force–distance curve (black) records the adhesion force of the cell, which is the maximum force acting on the cantilever and, thus, the force needed to initiate the detachment of the cell from its substrate. Subsequently, single receptor unbinding events are observed. Rupture events are recorded when the CAM–ligand bond of a cytoskeleton-linked CAM fails. Tether events are recorded when a membrane tether is extruded from the cell membrane with the CAM at its tip (tethers). In the latter case, attachment of the CAM to the cytoskeleton is either too weak to resist the mechanical stress applied or non-existent. (D) To improve the throughput of SCFS experiments, a four-segmented coating mask is used, allowing adhesion force measurements of one cell to different adhesives substrates.

