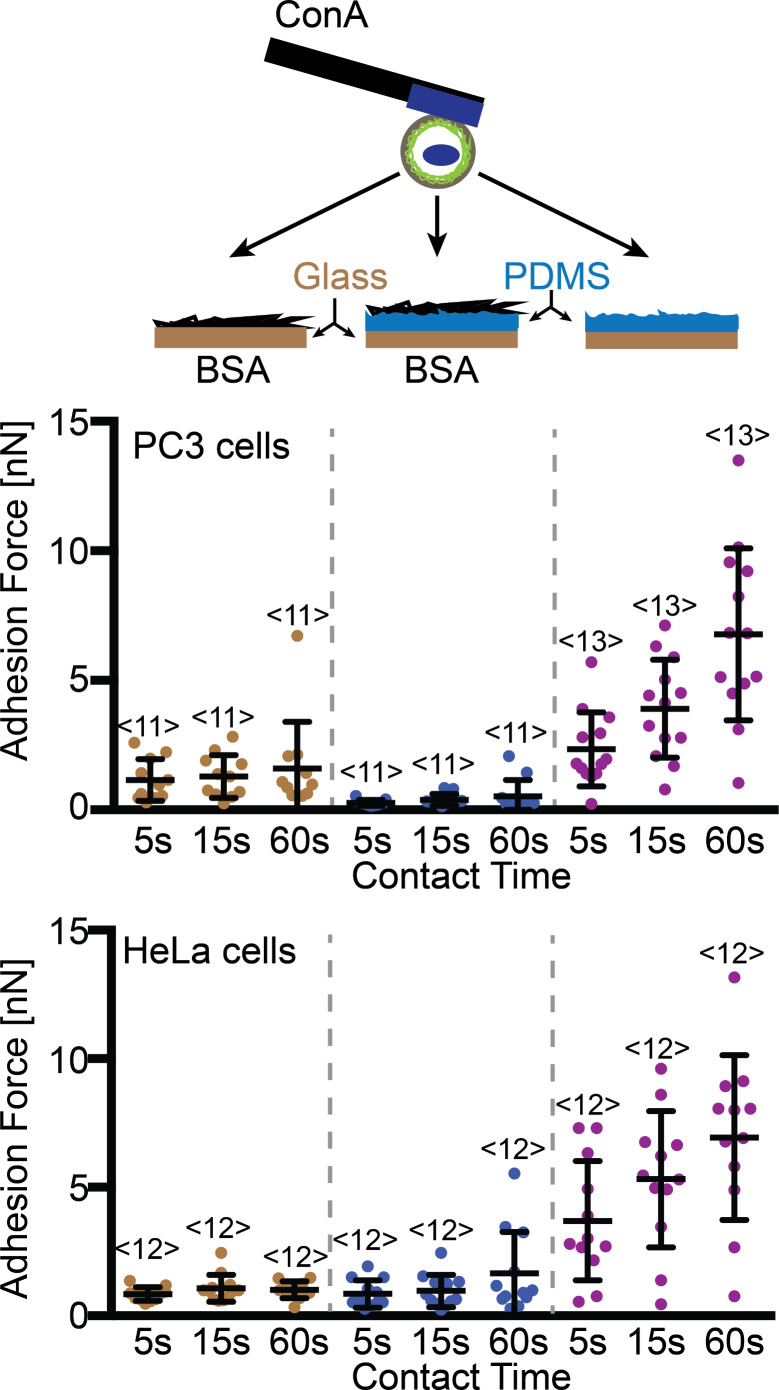
Figure 4.
Comparisons of glass-surface and PDMS-surface masks. Top, depiction of the SCFS assay used to quantify the adhesion of PC3 and HeLa cells. Single cells were bound to ConA-coated cantilevers and approached BSA-coated glass or PDMS and a clean PDMS surface until a force of 2 nN was recorded. After the denoted contact time, the cantilever was retracted to detach the cantilever-bound cell and substrate. During retraction, the adhesion force of cell and substrate was measured. Bottom: adhesion forces recorded for PC3 and HeLa cells during their detachment from substrates. Each dot represents the measurement of one cell with the number of cells assayed for each condition given by <n> The x-axis indicates the duration (5, 15 and 60 s) that the cell was in contact with the substrate before being detached. The error bars indicate mean force and standard deviation.

