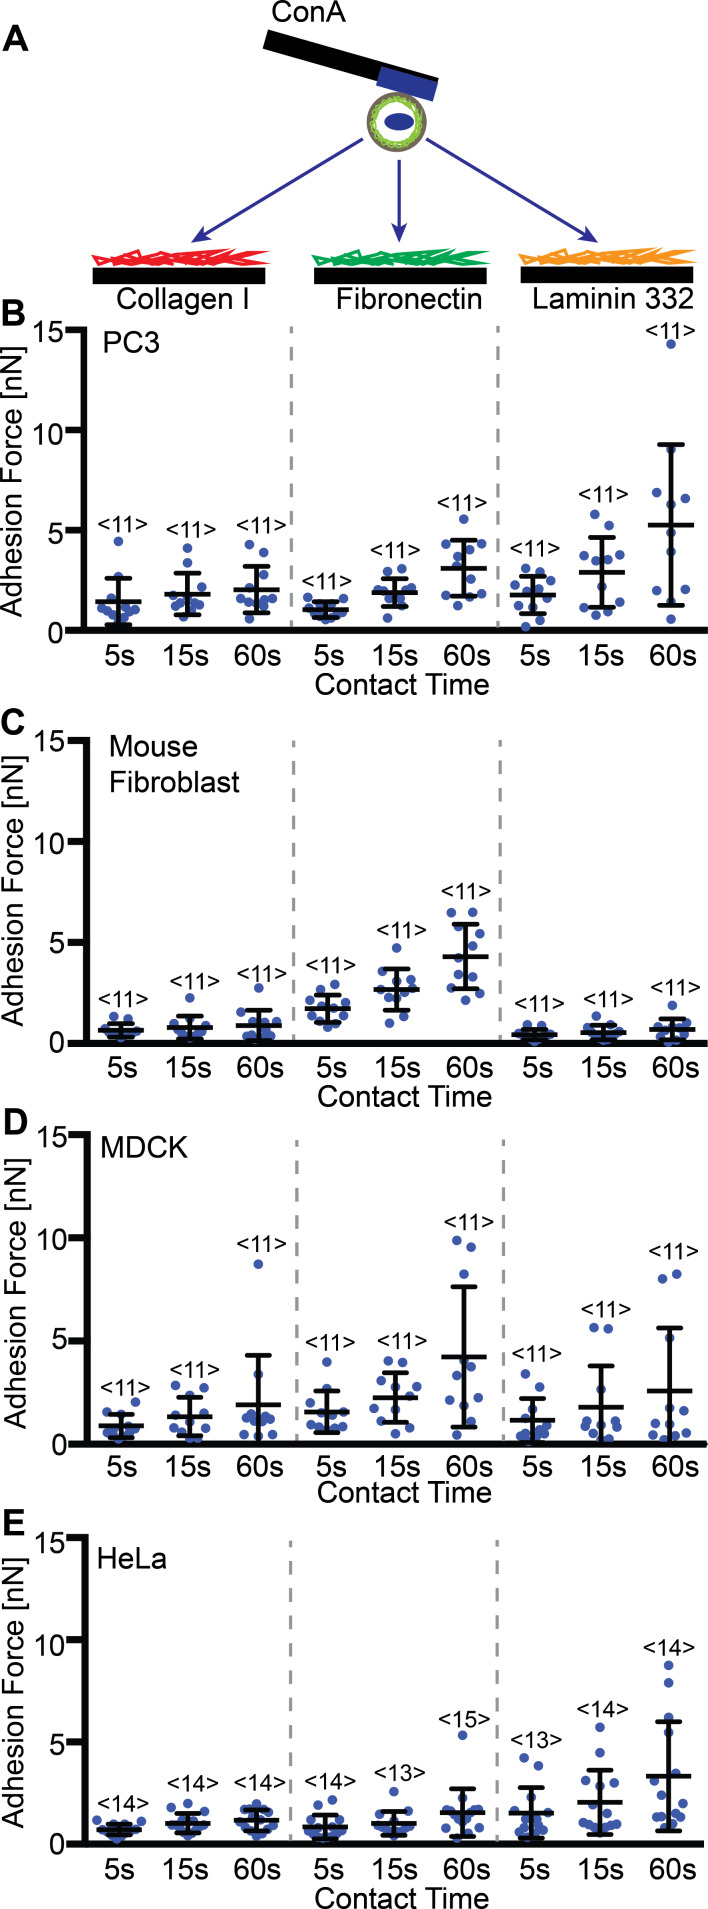
Figure 5.
Cell line-dependent adhesion of ECM proteins. (A) Depiction of the SCFS experimental setup, where the adhesion of a ConA bound cell is measured to different protein-coated surfaces. Graphs of the adhesion forces measured for PC3 (B), mouse fibroblasts (C), MDCK (D) or HeLa (E) cells to collagen I, fibronectin and laminin 332 coated PDMS surfaces after contact times of 5, 15 and 60 s. Each dot represents the measurement of one cell. The number of cells assayed for each condition is given by <n>. Error bars indicate mean force and standard deviation.

