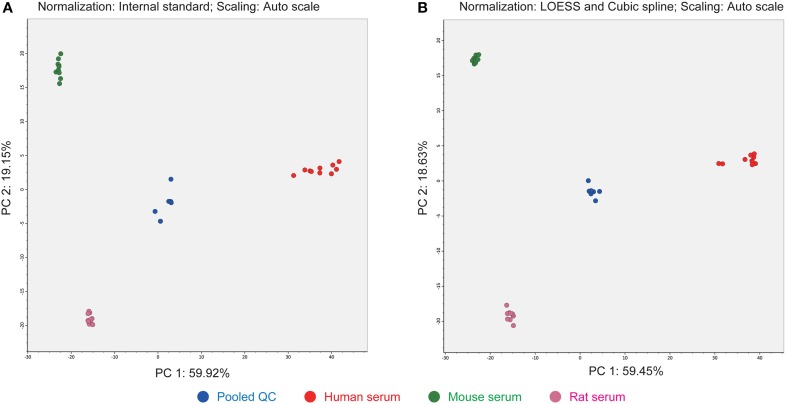
Figure 4.
Differences in PCA score plots of internal standard- and LOESS/cubic spline-based normalizations. (A) The metabolite signals were normalized by one internal standard PC (12:0/12:0). (B) The metabolite signals were corrected by LOESS and cubic spline in combination with the abundances of pooled QC datasets that were analyzed at every five biological samples. This result shows that the clusters of each serum class were much improved with LOESS and cubic spline normalization.

