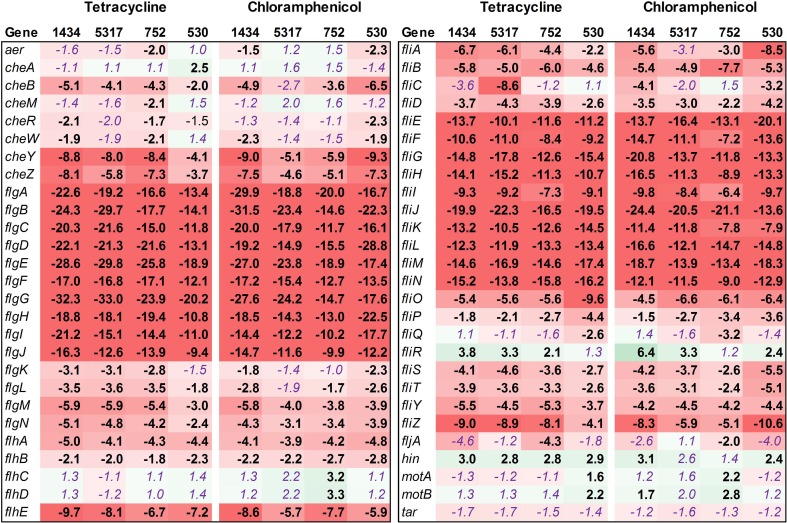
Figure 4.
RNA-seq analysis of genes associated with motility. RNA-seq identified the fold-change in expression of genes associated with motility due to exposure to the antibiotics tetracycline (16 μg/ml) or chloramphenicol (64 μg/ml) when compared to the no-antibiotic control. Numbers in bold are significantly different (FDR-adjusted P < 0.05), while numbers in purple italics are not significant. Green denotes increased gene expression, and red indicates decreased gene expression; the intensity of the color highlights greater change.

