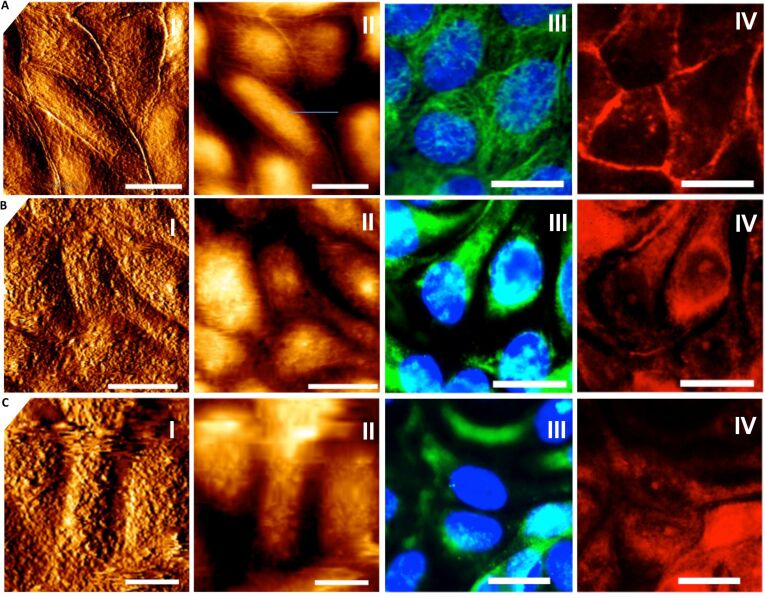
Figure 1.
Confluent MDCK II cells treated with different concentrations of CTAB functionalized gold nanorods. A: untreated cells. B: cells incubated for 24 h with 6 μg/mL CTAB rods. C: cells incubated for 24 h with 24 μg/mL CTAB rods. I: AFM contact mode height images. II: deflection images. III: fluorescence microscopy images of microtubules (green) and nucleus (blue). IV: fluorescence microscopy images of F-actin filaments (red). Scale bar: 10 μm.

