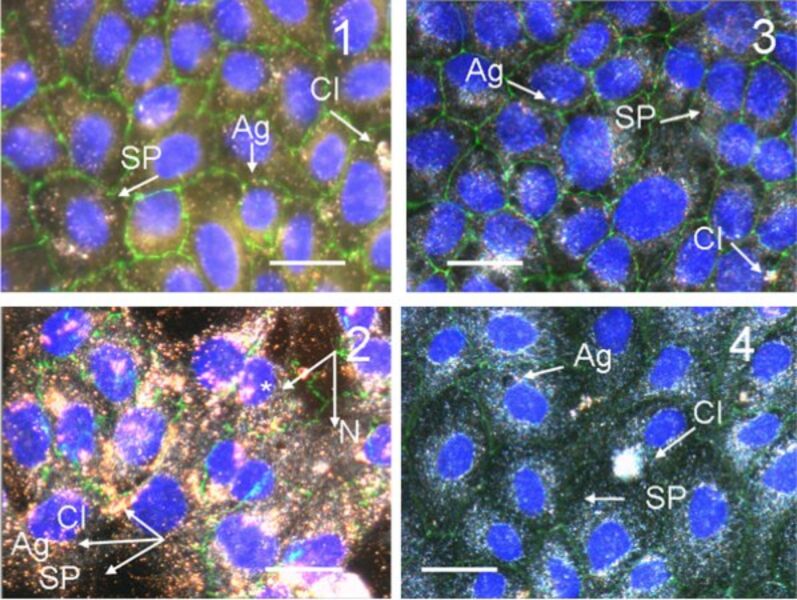
Figure 2.
Dark-field/fluorescence microscopy image (overlay) of confluent MDCK II cells treated with gold nanorods after 24 h. Image 1: Cells exposed to 0.14 μg/mL CTAB coated gold nanorods per mL. Image 2: Cells exposed to 2 μg/mL CTAB coated gold nanorods per mL. Image 3: Cells exposed to 4.0 μg/mL COOH-PEG coated gold nanorods per mL. Image 4: Cells exposed to 4.0 μg/mL NH2-PEG coated gold nanorods per mL. The images are overlayed with a fluorescence images using DAPI (nucleus, blue, *) and ZO-1 (cell borders, green) staining. Arrows indicate the particles (SP: single particle; Ag: aggregate; Cl: cluster, N: nucleus). We refer to clusters as very large aggregates of nanorods. Scale bar: 20 μm.

