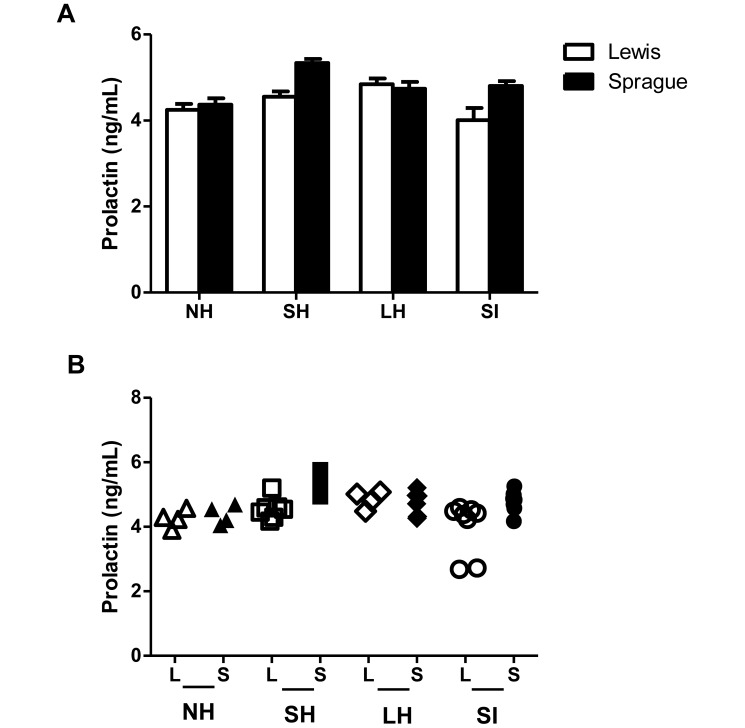
Figure 4.
(A) Prolactin concentrations in blood collected 30 min after the last handling bout or injection. Concentrations were similar for both strains and did not change as a result of handling. Error bars represent 1 SD. (B) Scatter plot showing individual prolactin concentrations. There was no difference in variability between strains, and variability remained consistent for both Lewis and Sprague–Dawley rats across handling groups. L, Lewis; S, Sprague–Dawley. NH, no handling; SH, short handling; LH, long handling; SI, saline injection.

