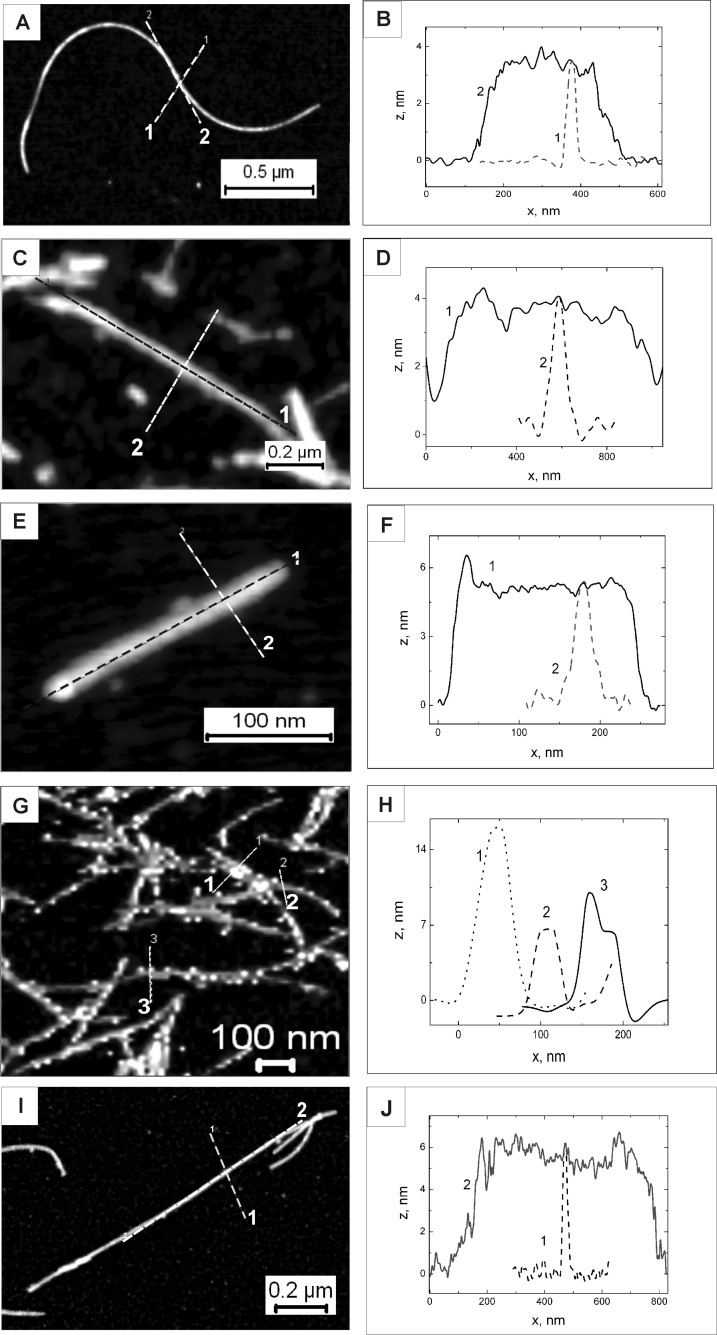
Figure 2.
AFM topography images with cross-sectional and axial profiles. α-SynC141 fibril (A and B), fibrils reduced with tris(2-carboxyethyl)phosphine (TCEP) (C and D), biotinylated α-SynC141 fibrils after reduction with TCEP (E and F), biotinylated α-SynC141 fibrils after incubation with neutravidin-conjugated gold nanoparticles (G and H), and α-Syn fibrils (I and J). The dashed lines in the AFM images indicate the location where the cross-sections and axial measurements were taken.

