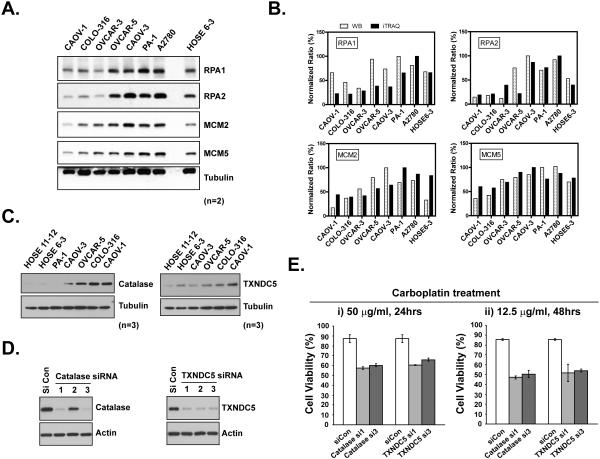
Figure 7. Biochemical validation of the role of iTRAQ candidate proteins in carboplatin chemosensitivity.
(A) Cells were lysed in SDS-containing RIPA buffer and protein expression levels were measured by immunoblotting with the indicated antibodies against RPA1, RPA2, MCM2, MCM5 and β-Tubulin, used as a normalization control. Results have been verified in duplicate (n=2). (B) Results from (A) were quantitated with program ImageJ and the relative ratio after normalization was compared in parallel with iTRAQ value per gene per cell line. (C) Analysis of the expression of catalase and TXNDC5 by immunoblotting with indicated antibodies. Results have been verified in triplicate (n=3). (D) Control and target gene siRNA were electroporated into CAOV1 cells. After 48hrs, knockdown efficiency was demonstrated by immunoblotting. (E) 24hrs after siRNA delivery, CAOV1 cells were re-seeded into 96-well plates. Carboplatin was then added and incubated for indicated time. CellTiter-Glo Luminescent Cell Viability Assay was performed to illustrate the carboplatin response. Results represent mean ± S.D. from three independent experiments.

