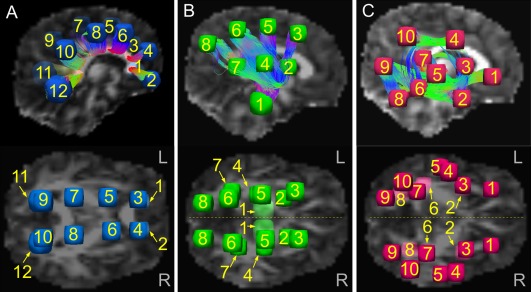
Figure 1.

Initial locations of target ROIs, with example tractographic connections (top panels). (A) Pairs of target ROIs for connections through the CCCR. (B) The top panel shows targets for R‐projection fibers (R‐PROJ), and the lower panel shows an axial view of both L‐ and R‐PROJ. (C) The top panel shows targets for R‐association fibers (R‐ASSOC), and the lower panel shows both L‐ and R‐ASSOC. In all networks, mini‐probabilistic tractography was required to find homologous target locations based on WM tracts (Region Selection and Tractographic Analyses Section and Appendix for details). All sets of ROIs were mapped to each subject's native diffusion weighted space for tractogaphy. [Color figure can be viewed in the online issue, which is available at http://wileyonlinelibrary.com.]
