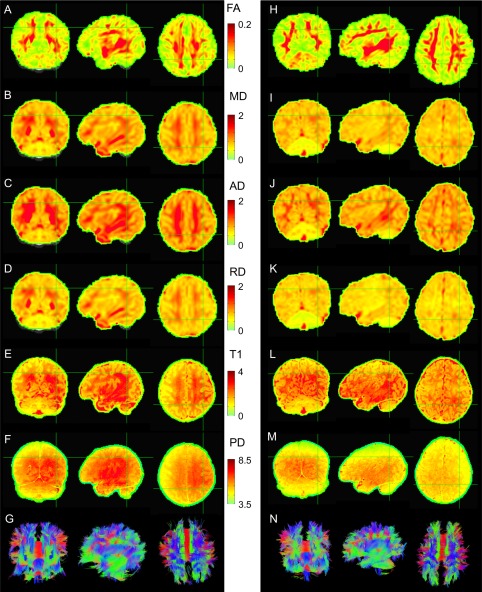
Figure 2.

Examples of parameter maps and whole brain (mini‐probabilistic) tractography for one HC (A–G) and one PAE (H–N) infant (views by column: fronto‐coronal, L‐sagittal, and supero‐axial). Units of MD, AD, and RD are 10−3 mm2 s−1; units of T1 are s; units of PD are arbitrary 103. Tractography coloration (G and N) is by local tract direction: left‐right (red), anterior‐posterior (green), inferior‐superior (blue). [Color figure can be viewed in the online issue, which is available at http://wileyonlinelibrary.com.]
