
Figure 3.
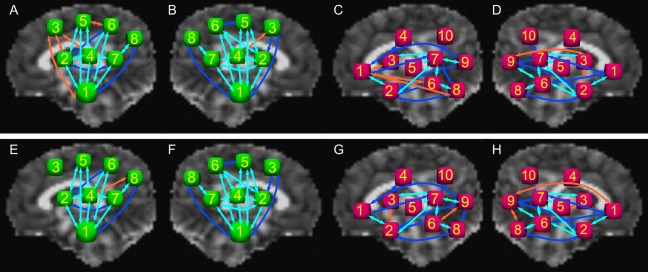
Schematic representation and comparison of WM‐ROI connections found among target ROIs in the majority of subjects in the HC and PAE groups for the projection and association networks. R‐PROJ, L‐PROJ, R‐ASSOC, and L‐ASSOC are shown for HC in panels A–D, respectively, and for PAE in panels E–H. Arrows in light blue represent connections for all subjects in both groups; in dark blue, for connections in at least 80% of subjects in both groups; in orange, for at least 80% of subjects in one group but not the other. [Color figure can be viewed in the online issue, which is available at http://wileyonlinelibrary.com.]