
Figure 6.
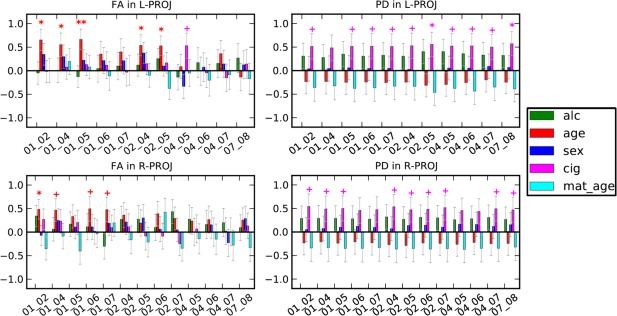
Locations of trend and higher significance from multivariate analyses of each WM‐ROI for FA (left column) and PD (right column). Values are standardized regression coefficients ±SD. Alc = frequency of maternal drinking during pregnancy; age = infant age since conception; sex (1 = male, 2 = female); cig = average number of cigarettes smoked during pregnancy; mat. age = maternal age at delivery. + P ≤ 0.10, *P < 0.05, **P < 0.01, ***P < 0.001. The predictor abbreviations are: alc, maternal frequency of drinking; age, infant weeks since conception at scan; cig, mother's average cigarette smoking during pregnancy; mat. age, maternal age at delivery. [Color figure can be viewed in the online issue, which is available at http://wileyonlinelibrary.com.]