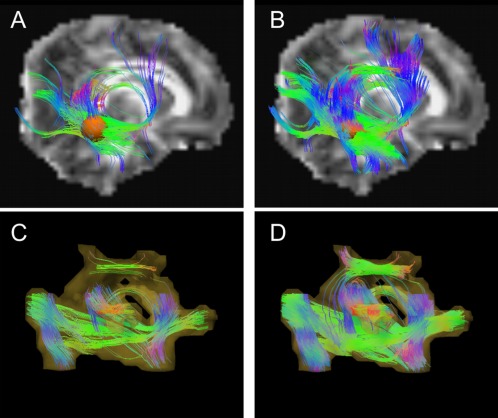
Figure A1.

Example comparisons of deterministic (A and C) and the novel mini‐probabilistic (B and D) tractography. Panels in the top row show reconstructed tracts passing through a single target ROI (orange), with greater extent and volume of output apparent in the mini‐probabilistic case (and very few obvious errors). Panels in the bottom row present the comparison of network‐wide tracts (R‐ASSOC network, AND logic; see main text) with full‐probabilistic results (translucent surface). Again, mini‐probabilistic tracts show greater volume and extent, with notably few false positives by comparison with full probabilistic tracking. [Color figure can be viewed in the online issue, which is available at http://wileyonlinelibrary.com.]
