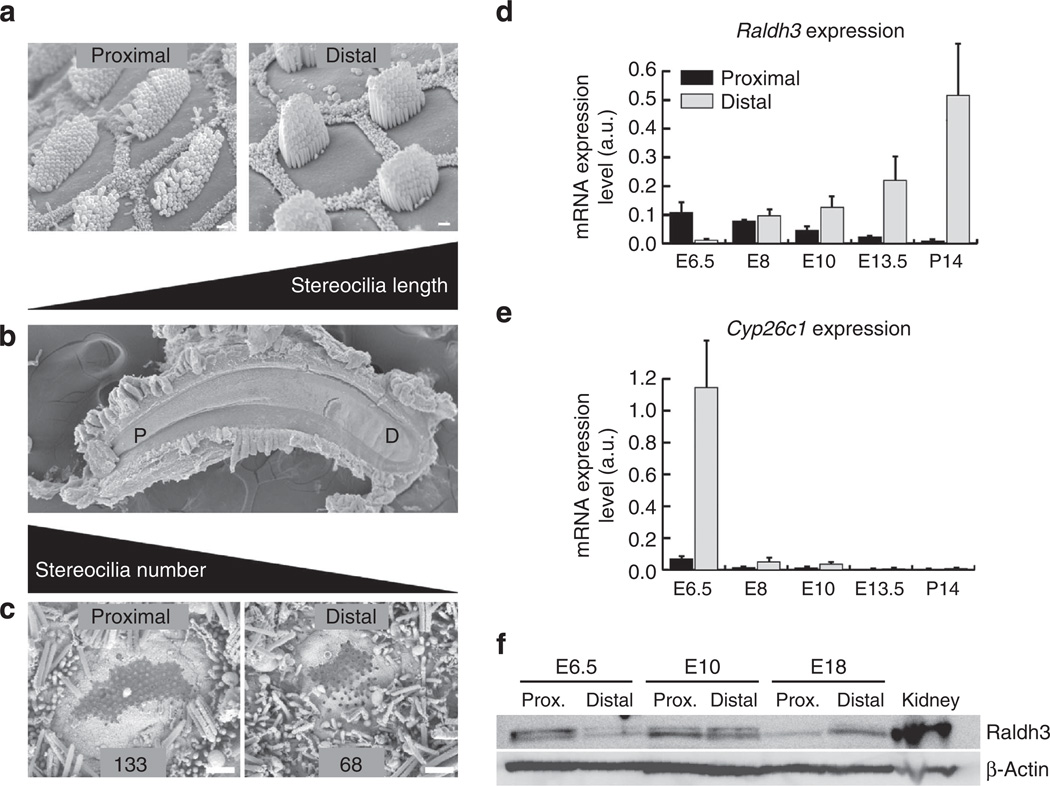
Figure 1. Gradients of HC phenotypes develop along the longitudinal axis of the chicken cochlea.
(a) Scanning electron micrographs (SEM) showing short sensory hair bundles that project from the apical surfaces of HCs at the proximal end of the BP sensory epithelium and tall bundles of HCs at the distal end. The HCs are surrounded by honeycomb-like patterns comprising the microvilli-covered surfaces of SCs. (b) Low-magnification SEM image showing the sickle-shaped BP, which is narrow proximally (P) and broad distally (D). (c) SEM images of HCs that formed in vitro in E6.5 BPs cultured in control medium for 7 days. The hair bundles in these micrographs were broken off so that the bases of the individual stereocilia could be counted, which showed that the HCs at the proximal end of cultured BPs contained more stereocilia than HCs at the distal end as do HCs that develop in ovo. (d) Histogram showing developmental changes in mRNA levels for the RA synthetic enzyme, Raldh3, in the proximal (dark bars) and distal (light bars) halves of BP as measured in qRT–PCR. At E6.5, Raldh3 is expressed in a proximal-to-distal gradient, which reverses and becomes a strengthening distal-to-proximal gradient at later stages of cochlear development. (e) Histogram of mRNA levels for the RA-catabolizing enzyme, Cyp26c1, measured from qRT–PCR. At E6.5, Cyp26c1 is expressed in a distal-to-proximal gradient, but mRNA expression declines to barely detectable levels at later developmental stages. Graphs show the mean mRNA expression levels (arbitrary units) measured in the proximal and distal regions ± s.e.m. (f) Representative western blot for of Raldh3 and β-actin protein in the proximal and distal halves of E6.5, E10 and E18 cochlea (n = 3). E18 kidney was used as a positive control tissue and β-actin was used as a loading control. At E6.5, Raldh3 was enriched 4.43-fold in the proximal BP compared with the distal BP, but the relative protein levels reverse as development progressed, with 3.87-fold more Raldh3 protein in the distal BP than in proximal BP at E18. Levels were approximately equivalent in the proximal and distal E10 BPs. Scale bars, 1 µm.

