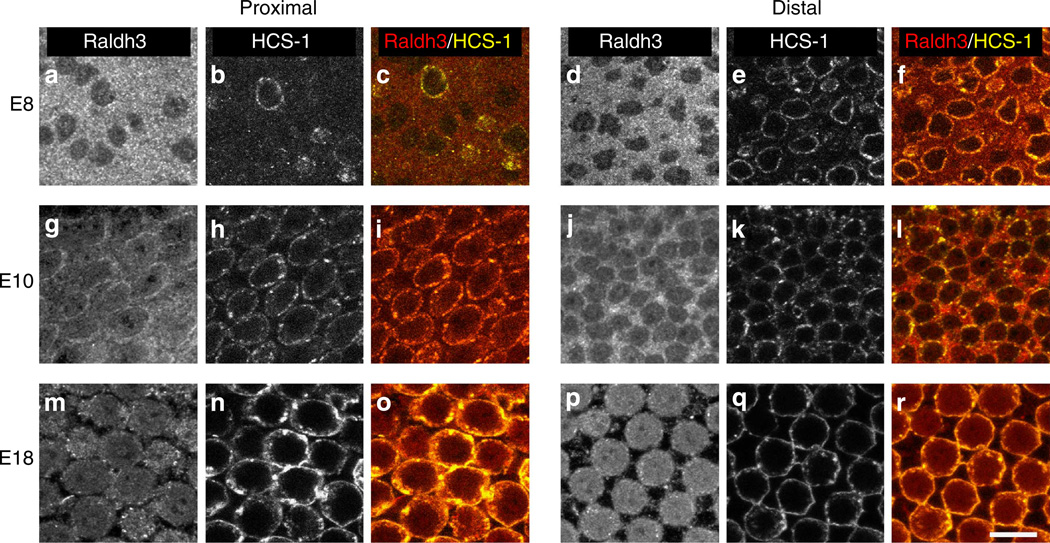
Figure 2. Raldh3 predominately expressed in SCs early in development, but HCs become the predominant expressers at later stages.
Representative images from immunolabelling using antibodies to Raldh3 (a,d,g,j,m,p) and HCS-1 (otoferlin) (b,e,h,k,n,q) in the proximal (left) and distal (right) regions of the BPs from embryos at E8 (a–f), E10 (g–l) and E18 (m–r). The grey scale images in the far left on each side show Raldh3 immunofluorescence. Middle panel images show HCS-1 immunofluorescence, and images in the far right panels on each side show the merged immunofluorescence from Raldh3 (red) and HCS-1 (yellow). At E8, the antibody to Raldh3 most strongly labelled the SCs, which are negative for HCS-1, but labelling in HCs increased at E10, and at E18, Raldh3 was predominantly expressed by HCs. Each immunolabelling experiment was independently replicated three times. Scale bar, 10µm.

