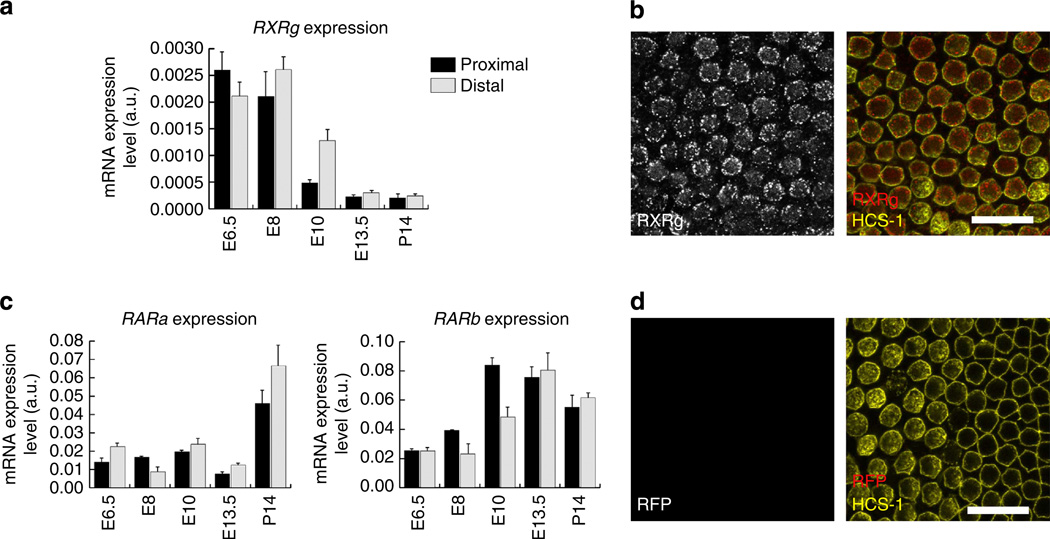
Figure 4. RA nuclear receptor expression in the developing cochlea.
(a) Histogram showing RXRγ mRNA expression levels measured from qRT–PCR of the proximal (dark bars) and distal (light bars) regions of E6.5, E8, E10, E13.5 and P14 BPs. RXRγ becomes expressed in a distal-to-proximal gradient at E8 and E10. (b) Representative confocal micrograph showing RXRγ (red) and HCS-1 (yellow) immunofluorescence in E18 BPs. Left panel shows grey scale from RXRγ alone and the right panel shows the merged immunofluorescence from RXRγ (red) and HCS-1 (yellow). RXRγ immunofluorescence is observable within the HCS-1-positive HCs. (c) Histograms showing mRNA expression levels for RARα and RARβ in proximal (dark bars) and distal (light bars) regions of E6.5, E8, E10, E13.5 and P14 BPs. Throughout the stages of development assessed, these nuclear receptors were expressed in both ends of the BP. (d) Representative negative control immunofluorescence with red fluorescence protein (RFP) antibody. Left panel shows grey scale from RFP alone and right panel shows immunofluorescence from RFP (red) and HCS-1 (yellow). Each immunolabelling experiment was independently replicated three times. Graphs show the mean mRNA expression levels (arbitrary units) measured in the proximal and distal regions ± s.e.m. Scale bars, 20µm.

