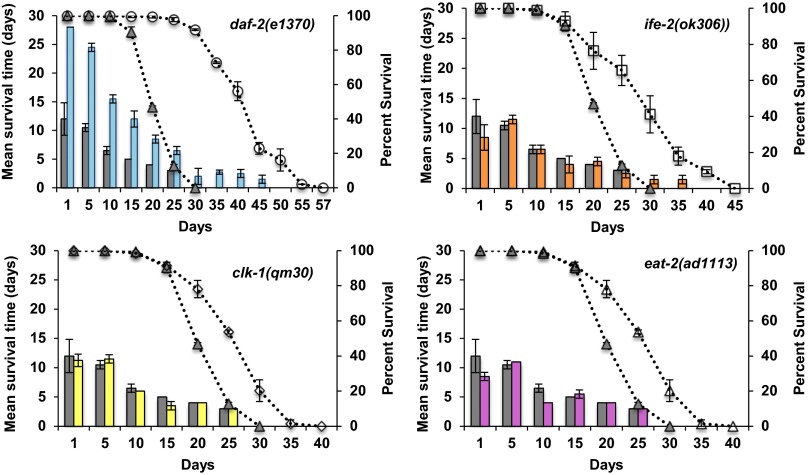
Fig. 3.
Resistance to oxidative stress decreases with age. Each graph represents a different long-lived mutant compared with wild type. The bar graph shows the average of the mean survival time under oxidative stress for a population of aging animals for two biological repeats, plotted on the primary (left) y axis. The dotted lines represent the percent survival of the individual strains (lifespan analysis), plotted on the secondary (right) y axis. Wild type is shown in each graph as gray bars and gray triangles. (Upper Left) daf-2(1370), blue bars and open circles. (Upper Right) ife-2(ok306), orange bars and open squares. (Lower Left) clk-1(qm30), yellow bars and open diamonds. (Lower Right) eat-2(ad1113), pink bars and open triangles. For all strains, oxidative stress resistance was measured for different ages of each strain until 80% of the animals were dead and declines with age. Compared with wild type chronologically, daf-2 mutants are more resistant to oxidative stress whereas ife-2 and clk-1 mutants are more sensitive to oxidative stress. Chronologically, compared with wild type, eat-2, ife-2, and daf-2 mutants show a similar rate of decline whereas clk-1 mutants have a slower rate of decline in oxidative stress resistance. Compared with wild type physiologically (age-matched population), ife-2 and clk-1 mutants show a similar rate of decline whereas daf-2 and eat-2 mutants show a faster rate of decline in oxidative stress resistance capacity (see text for additional details). Error bars represent SE from two biological repeats.

