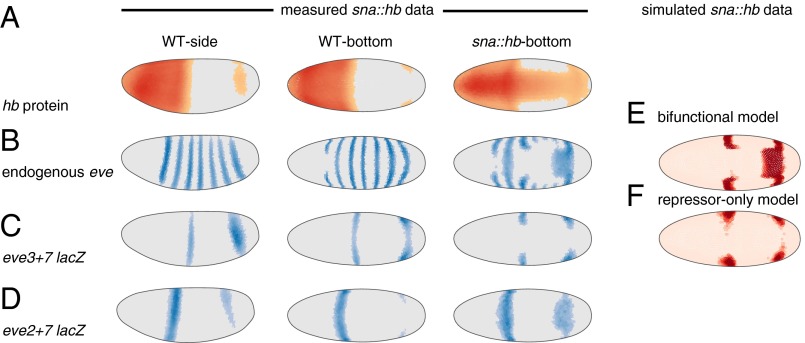
Fig. 4.
In hb ventral misexpression (sna::hb) embryos the bifunctional model predicts the endogenous pattern whereas the repressor-only model predicts the eve3+7 reporter pattern. (A) Hb protein in WT and sna::hb embryos (Left, lateral view; Right, ventral view). These data are computational renderings of gene expression atlases that average together data from multiple embryos (see Fig. S8 for number of embryos per time point). The relative expression level of each gene is shown in individual cells; cells with expression below an ON/OFF threshold (Materials and Methods) are plotted in gray. For cells above this threshold darker colors indicate higher relative amounts. (B) Endogenous eve pattern. (C) The eve3+7 reporter pattern. Both stripes retreat from ectopic Hb. (D) The eve2+7 reporter pattern. Stripe 7 expands into the ectopic Hb domain. (E and F) Bottom (ventral) view of predictions of the bifunctional model (E) and repressor-only model (F) based on simulated sna::hb data (adapted with permission from ref. 24). OFF cells are light pink and ON cells are red. All data and modeling are from cohort 3 (other time points are shown in Fig. S8).

