Fig. 3.
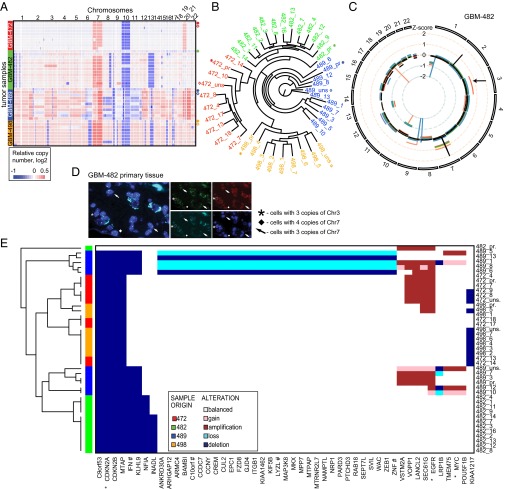
Heterogeneous clonal genetics as mapped by copy number (CN) analysis. (A) Probe-level CN heat map shows genetic variation in clonal populations. Samples are grouped vertically by patient tumor (left vertical color bar; right label: asterisk, primary sample; diamond, unsorted population). (B) Phylogenetic analysis confirms the common origin of derived clones (colors) and shows that primary samples (asterisks) are relatively distant from derived clones. (C) Circos plot of segmented CN alterations in GBM-482. Inner circle represents baseline (no CN change), and lines expanding toward the center or the periphery of the diagram represent CN losses or gains, respectively (primary, black; clonal, colored). (D) FISH confirms chr3 gain in primary tumor tissue of GBM-482. (E) Heat map of frequently altered genes with clonal heterogeneity (at least five alterations).

