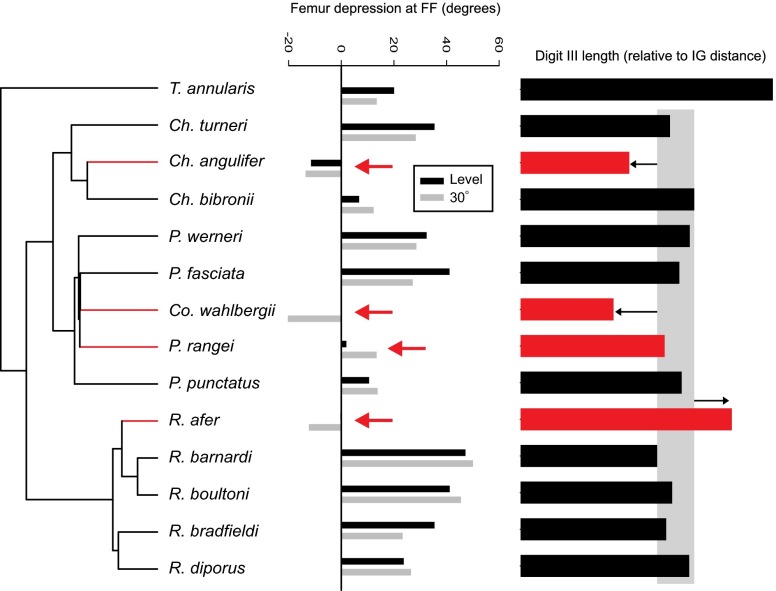
Fig. 2.
Femur depression at footfall and the relative length of pedal digit 3 mapped onto the phylogeny of the members of the Pachydactylus radiation that we examined. Each value represents the average of multiple individuals, and for femur depression, both level (black) and incline (gray) are shown. The red arrows indicate the values for species within the Asimp group. Note that values are significantly lower for the Asimp species, reflecting a sprawled posture. In addition, the rate of evolution of femur depression at footfall was more than nine-times greater in the Asimp group than the Afunc group. The relative lengths of pedal digit 3 are shown to the right. To highlight one striking instance of morphological conservation, the gray bar encompasses the range of pedal digit 3 lengths in Afunc members of the Pachydacytus radiation that we examined. The arrows indicate the reduction or elongation of Asimp species relative to the range delineated by the Afunc group.

