Fig. 3.
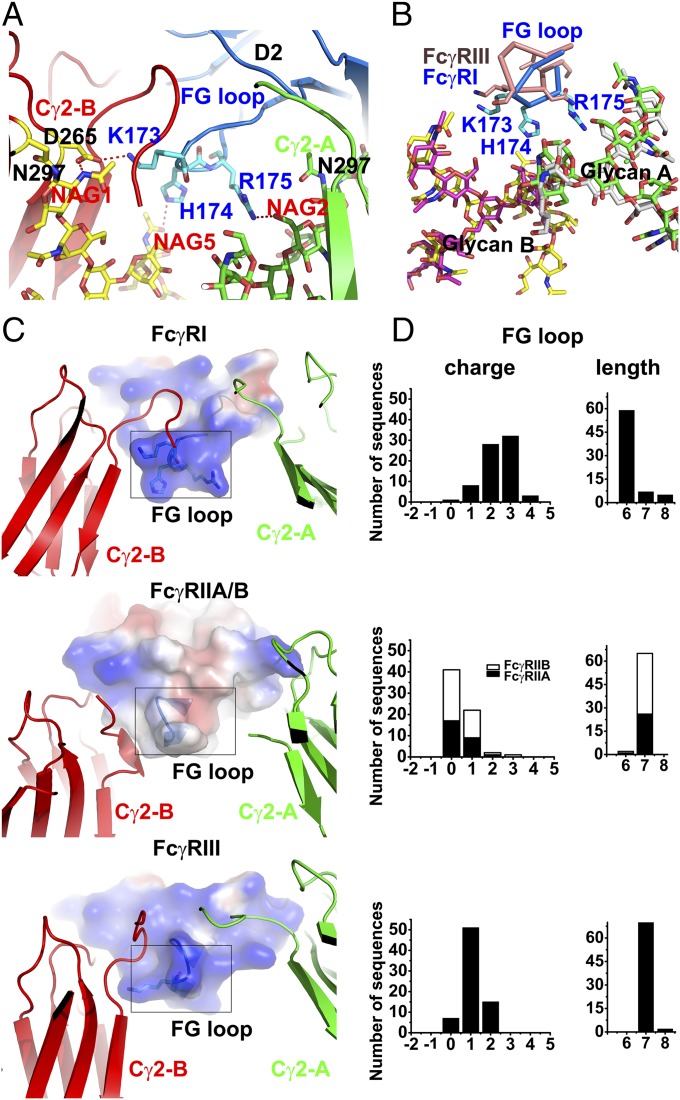
(A) Detailed contacts between the FcγRI D2 domain FG loop and Fc with glycans associated with the Fc A and B chains in green and yellow, respectively. (B) Structural comparison of the FG loop conformation between FcγRI (blue) and FcγRIII (wheat). The structures are superimposed on their Fc A chain. The glycans (magenta and white) from FcγRIII-Fc complex (PDB ID code 1T83) and the glycans (yellow and green) from the current FcγRI-Fc complex are well superimposed. The FG loop of FcγRI is positioned closer to the carbohydrates. (C) Electrostatic potential [−50, 0, 50] of the D2 domain FG loop calculated for FcγRI (Top), FcγRIIA/B (Middle; PDB ID codes 3WJJ and 3RY6), and FcγRIII (Bottom; PDB ID code 1T83). (D) Distribution of the FG loop charge and length among homologous mammalian FcγRI (Top), FcγRIIA (Middle; solid bars), FcγRIIB (Middle, shaded bars), and FcγRIII (Bottom) receptors.

