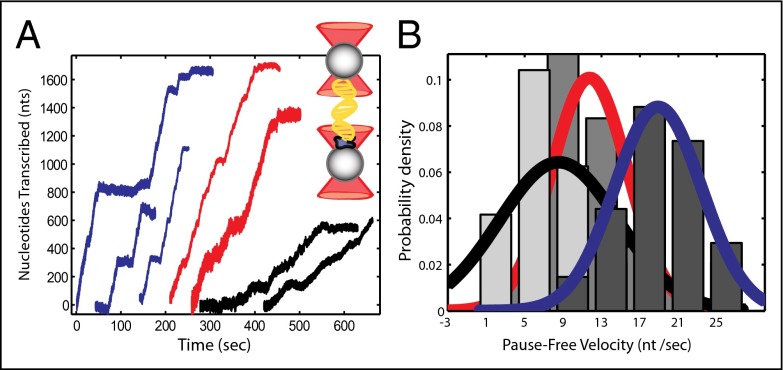
Fig. 1.
Single molecule transcription by E. coli RNA polymerase WT and TL mutants. (A) Individual transcriptional events from passive mode experiments for the WT (red) and the fast and slow mutants (blue and black, respectively). Unfiltered traces were processed to remove pauses and generate histograms of the pause-free velocity. Inset: The double trap geometry, in which stalled RNAP (in blue) is attached to one of the beads, whereas the downstream end of the DNA is attached to the other bead. (B) Histograms of the pause-free velocity for the slow (light gray bars, black fit, n = 12) and fast mutant (dark gray bars, blue fit, n = 17). Velocities for the WT polymerase (gray bars, red fit, n = 18) are also shown for comparison.

